Posts

Easy Media Management with exiftool

I struggled for years to manage pictures effectively but a nice Linux tool (exiftool) exists to make it very manageable, here are some use cases I use frequently:

Change all times of all pictures in directory by one hour:
(change number/sign for any other hours, it is clever and will adjust day if crosses midnight etc.)

$ exiftool -AllDates+=1 -overwrite_original *

Remove all EXIF metadata from images with “.jpeg” extensions only:

exiftool -all= *.jpeg

Add if statements to operations if required: (for example only adjust picture taken with Canon Cameras)

$ exiftool -AllDates+=1 -overwrite_original -if '$make eq "Canon"' -r *

Some other rename commands that help with naming if required:

Cuts start of filename: (by 4 letters, adjust as required) (-n = dry run)

$ rename -n -v  's/^(.{4})//' *

Changes file extensions from upper case to lower case.

rename 'y/A-Z/a-z/' *.JPG

That’s it for now!

Flight Tracking on RPi Zero. (Updated to include ADSB Exchange)

Originally I ‘built my own’ FlightRadar24 node using their straightforward tutorial. Its cool and you get free premium membership on their mobile app but a lot of flights are censored which is silly as I can read them directly off my node but FR24 won’t let me see them on the app. So I ended up doing a fresh install and now I feed FR24 and also ADSB Exchange which don’t censor any flights and have some awesome local interfaces, see below for tutorial:

Start with a fresh Raspbian install on RPI. Then we install:

sudo apt-get install dump1090-fa
sudo apt-get install piaware #Not 100% sure if this line required
sudo bash -c "$(wget -O - http://repo.feed.flightradar24.com/install_fr24_rpi.sh)"

The FR24 setup should guide you through first setup if its your first time, other wise you can reconfigure if you have your existing FR24 key:

sudo fr24feed --reconfigure --fr24key=your_key

I restarted the service, not sure if necessary, everything should be feeding FR24 now.

sudo systemctl restart fr24feed

See if service is running:

fr24feed-status

You can also see status if you go the FR24 local web GUI at http://192.168.1.XXX:8754/

Next we setup feed to ADSB Exchange:

sudo bash -c "$(wget -nv -O - https://raw.githubusercontent.com/adsbxchange/adsb-exchange/master/install.sh)"

It should also guide you through first setup, very straight forward, when finished you can check if service running:

sudo systemctl status adsbexchange-feed

You can see if your data is getting to ADSB Exchange by going to https://www.adsbexchange.com/myip/ and you can view the global aggregated data at https://tar1090.adsbexchange.com/

There are a few other fantastic packages to install to see current stats of your system:

Tar1090 is an amazing package that shows you what your node is currently seeing, install below and then use web interface at http://192.168.1.XXX/tar1090/

sudo bash -c "$(wget -q -O - https://raw.githubusercontent.com/wiedehopf/tar1090/master/install.sh)"

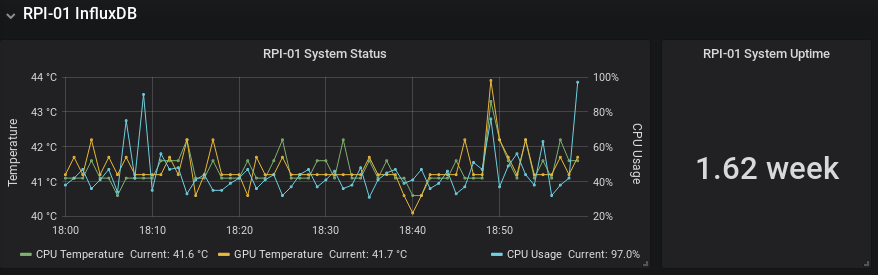
Timelapse1090 shows historical flights and you can replay flights etc, works well but data only stored in RAM so lost over reboot, my next plan is to write this to a database (now done). (viewable at: http://192.168.1.XXX/timelapse/)

sudo bash -c "$(wget -q -O - https://raw.githubusercontent.com/wiedehopf/timelapse1090/master/install.sh)"

Graphs1090 is supposed to show you performance of your node, number of aircraft seen etc., didn’t get it working yet but works well for others: (viewable at: http://192.168.1.XXX/graphs1090/)

sudo bash -c "$(wget -q -O - https://raw.githubusercontent.com/wiedehopf/graphs1090/master/install.sh)"

You can also see the data stream from your node by the below CLI command:

nc localhost 30003

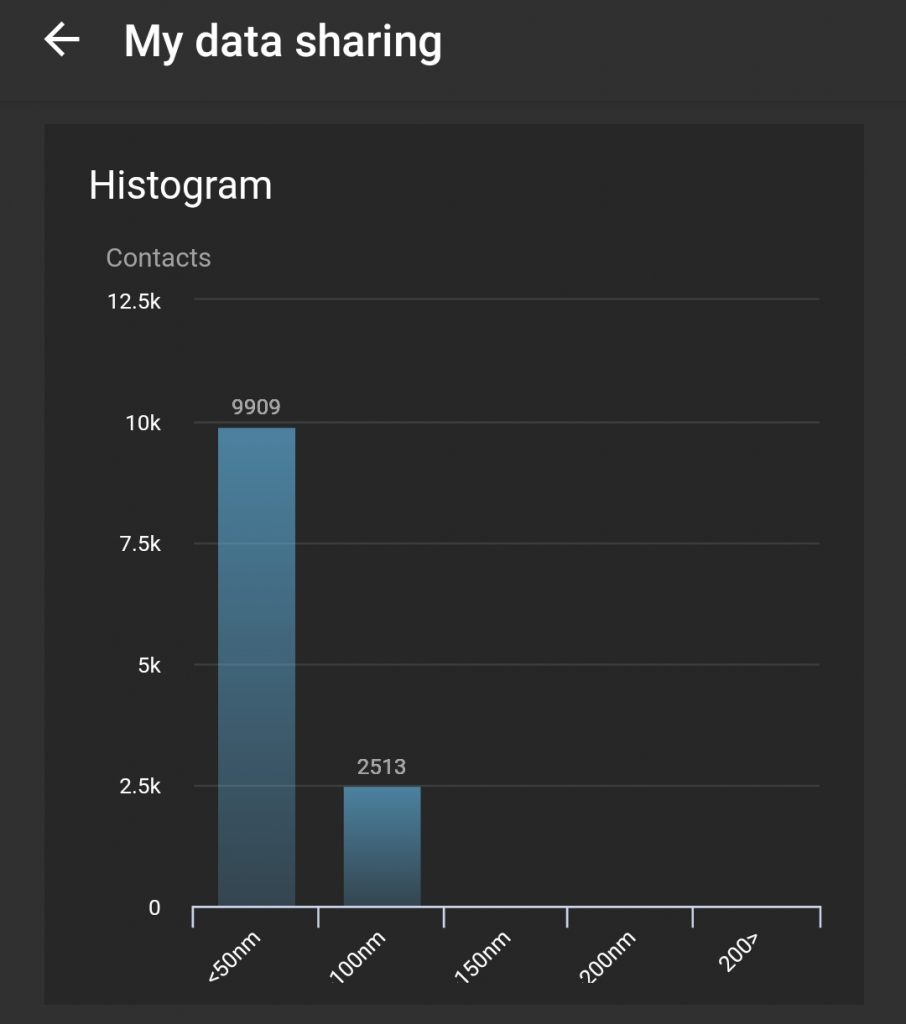
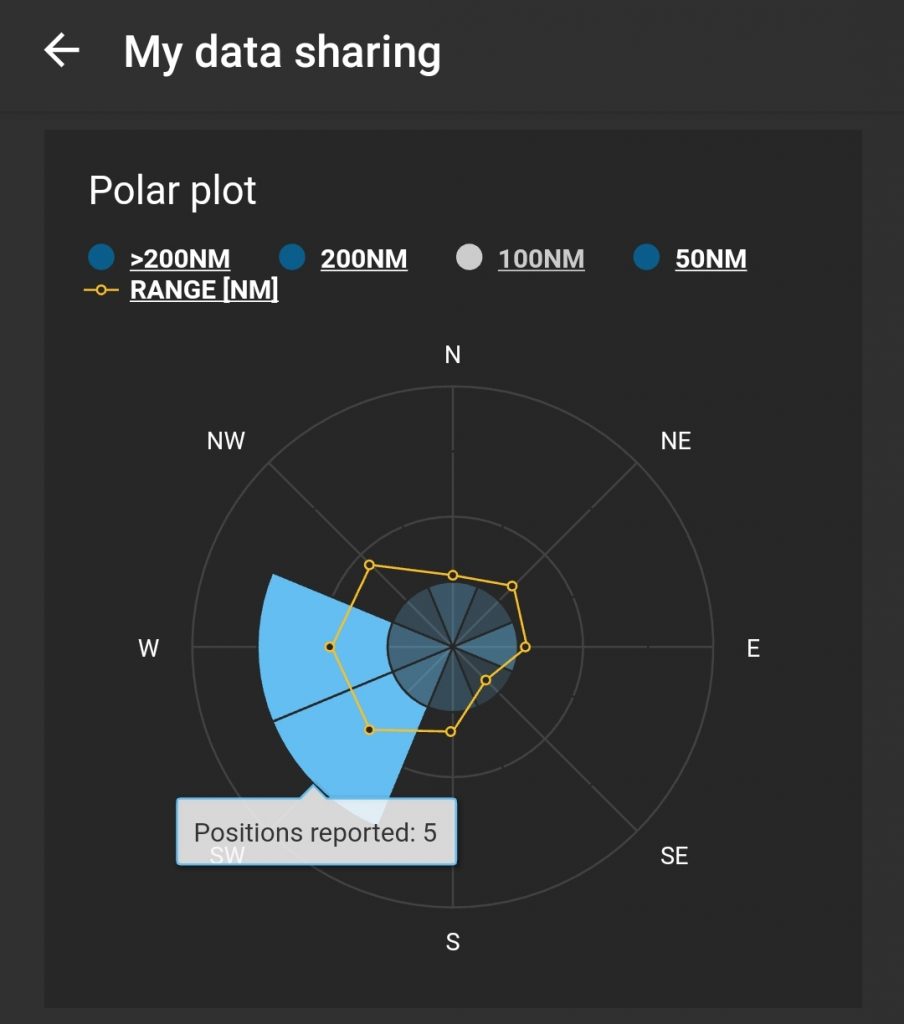
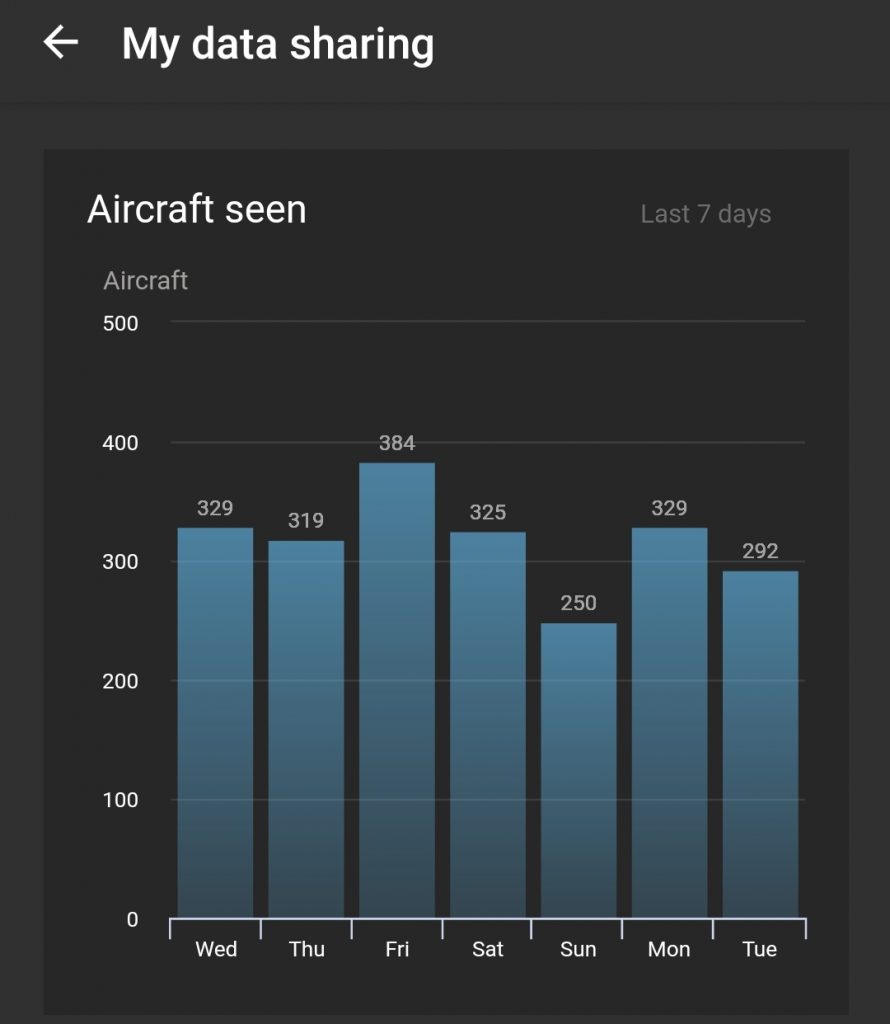
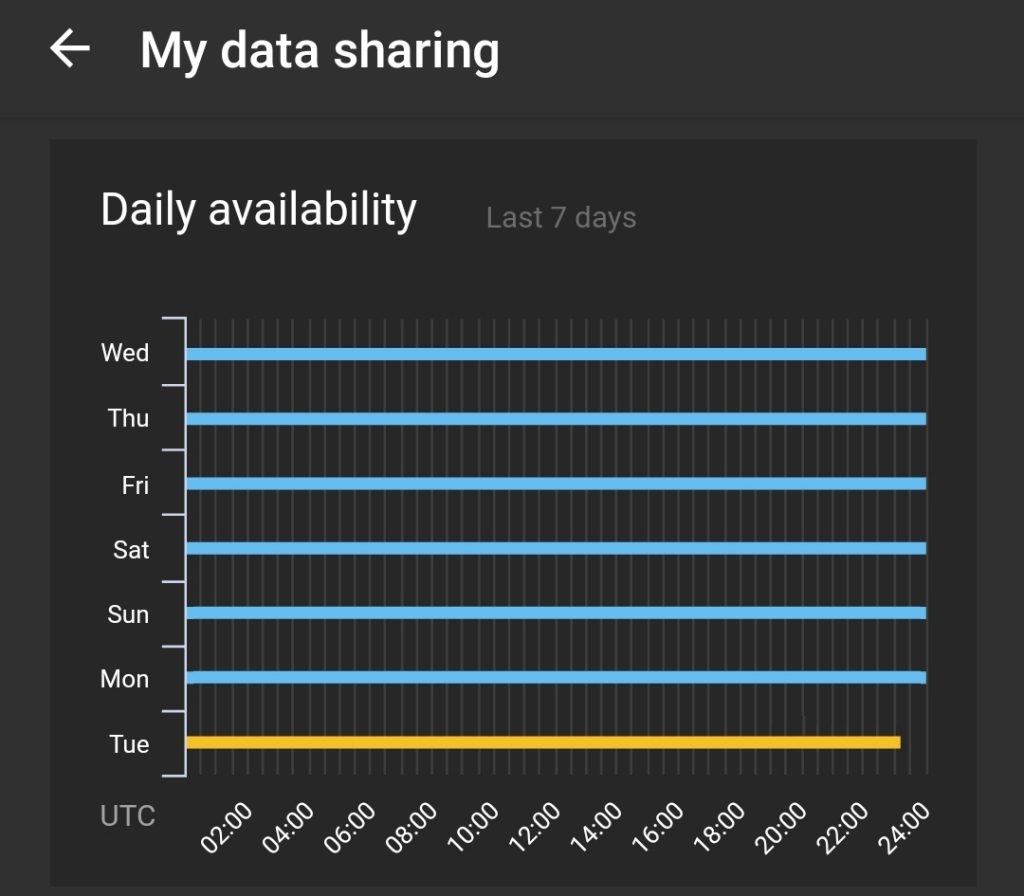
As an FYI below you can see the screenshots of the FR24 app showing the performance of my node a week after I set it up:

RPi Network CCTV Stream

I used motioneyeos for a number of years on Raspberry Pi’s (as both a Fast Network Camera and a NVR on separate devices) and while it was helpful for live viewing, the RPI really struggled on the recording frame rate.

I have since invested in a professional NVR but since I had the RPI’s lying around I decided to set them up to stream on my network and let them be captured by my new NVR or any other device that I want.

Start with a fresh install on the RPI and run the below commands:

raspi-config
#enable the camera if not done so already
sudo apt-get install ntpdate
sudo apt-get install vlc

Create a file on the Desktop called stream-rtsp.sh as per the below:

nano stream-rtsp.sh
!/bin/bash
raspivid -o - -t 0 -w 1296 -h 972 -fps 8 -b 2500000 -rot 180 -a 12 | cvlc -vvv stream:///dev/stdin --sout '#rtp{access=udp,sdp=rtsp://:8554/stream}' :demux=h264

Make the file execturable:

chmod +x stream-rtsp.sh

Test the script by running it manually:

./stream-rtsp.sh

Making the script run on startup by creating the file:

sudo nano /etc/systemd/system/stream-rtsp.service
[Unit]
Description=auto start stream
After=multi-user.target

[Service]
Type=simple
ExecStart=/home/pi/stream-rtsp.sh
User=pi
WorkingDirectory=/home/pi
Restart=on-failure

[Install]
WantedBy=multi-user.target

Set the service to auto start:

sudo systemctl enable stream-rtsp.service

Reboot the system and confirm the system started the service by:

sudo systemctl start stream-rtsp.service

Now lets check if the device is successfully streaming by on a different device launching VLC and navigating to Media –> Open Network Stream, enter the below (modify for your IP address) and click play:

rtsp://192.168.1.xxx:8554/stream

You should now see your camera screen. I will show you how to add this to Hikvision NVR in a later post.

XKCD Widget for RPi

Get your daily dose of XKCD with this python based random comic widget. Designed to run on Raspberry Pi Official 7″ LCD (800×480) but easily adapted to other screens and other picture sources if you wish.

Get the latest Python file from my GitHub: https://github.com/CactusProjects/xkcd-widget

Open up the terminal, install python packages and create a directory to keep things neat and put the github file into it:

sudo apt-get install python-bs4
sudo apt-get install python-imaging python-pil.imagetk
cd /home/pi/
mkdir code
#Copy the xkcd.py file into this directory/folder from GitHub.

Test the file:

python /code/xkcd.py

Great, all should work, lets create a Desktop shortcut:

cd /home/pi/Desktop/
nano xkcd.desktop

To make the shortcut work paste in the below code to this file and Ctrl + x to exit.

[Desktop Entry]
Version=1.0
Name=XKCD Widget
Comment=For Official RPI LCD.
Exec=python /home/pi/Desktop/code/xkcd.py
Icon=/home/pi/Desktop/code/xkcd_logo.PNG
Path=/home/pi/Desktop/code/
Terminal=false
Type=Application
Categories=Utility;Application;
StartupNotify=false

Give the shortcut executable permissions:

chmod +x xkcd.desktop 

Double click on the desktop icon and all should work. Currently do not have a logo for the icon but this is on the to do list.

RPi LCD Brightness Widget

I was surprised there was no way to adjust the backlight brightness out of the box for the official 7″ LCD (except for the command line obviously) so I made this widget to accomplish it.

Files available at my github: https://github.com/CactusProjects/rpi-brightness-widget/upload

First of all LCD brightness can be adjusted in the terminal using:

sudo sh -c 'echo "100" > /sys/class/backlight/rpi_backlight/brightness'

The range is 0-255 but nothing seems to happen after 200, if even get a little dimmer so my widget scales from 0-200. Put the .py & .png files in /home/pi/code directory. Put the .desktop file on your desktop. Make the files executable by:

cd /
chmod +x /home/pi/code/brightness_ex.py
chmod +x /home/pi/Desktop/brightness.desktop

The Desktop shortcut will work now but there was an annoying warning every time opening the file asking if wanted to execute the file in terminal etc., I got rid of it by opening the file manager, Go to Edit/Preferences/General, Check box for “Don’t ask options on launch executable file”

Now we have a shortcut that opens up the app to adjust the brightness but I wanted a taskbar shortcut:

Copy the .desktop file into the below two locations: (thanks to https://www.raspberrypi.org/forums/viewtopic.php?t=132072 for guidance on this)

cp /home/pi/Desktop/brightness.desktop /usr/share/raspi-ui-overides/applications/
cp /home/pi/Desktop/brightness.desktop /usr/share/applications/

Open /home/pi/.config/lxpanel/LXDE-pi/panels/panel and add the below code:

nano /home/pi/.config/lxpanel/LXDE-pi/panels/panel
    Button {
      id=brightness.desktop
    }

Restart GUI without a full reboot:

 lxpanelctl restart && openbox --restart

All done, the shortcut should now be on the taskbar. Delete the desktop shortcut if not needed.

One improvement left to do would be to have the widget automatically set maybe 50% brightness in the event it was accidentally set to 0 previously.

ESP8266 logging to InfluxDB (Ver 1.x & 2.x)

The ESP8266 is a $5 IOT device with huge capabilities. In this post we will log data to a remote Influx database running on a RaspberryPi.

I am programming the ESP8266 in the Arduino IDE, the ESP8266 library is required, you can find it here. I have a test code file (of copy from below) that you can upload after entering your InfluxDB I.P. Address, SSID & Password and it will start logging data immediately.

Code for InfluxDB Version 1.x (Version 1.6 specifically for me.)

#include <ESP8266WiFi.h>
#include <ESP8266WiFiMulti.h>
#include <InfluxDb.h>

#define INFLUXDB_HOST "192.168.1.1"   //Enter IP of device running Influx Database
#define WIFI_SSID "SSID"              //Enter SSID of your WIFI Access Point
#define WIFI_PASS "PASSWORD"          //Enter Password of your WIFI Access Point

ESP8266WiFiMulti WiFiMulti;
Influxdb influx(INFLUXDB_HOST);

void setup() {
  Serial.begin(9600);
  WiFiMulti.addAP(WIFI_SSID, WIFI_PASS);
  Serial.print("Connecting to WIFI");
  while (WiFiMulti.run() != WL_CONNECTED) {
    Serial.print(".");
    delay(100);
  }
  Serial.println("WiFi connected");
  Serial.println("IP address: ");
  Serial.println(WiFi.localIP());

  influx.setDb("esp8266_test");

  Serial.println("Setup Complete.");
}

int loopCount = 0;

void loop() {
  loopCount++;

  InfluxData row("data");
  row.addTag("Device", "ESP8266");
  row.addTag("Sensor", "Temp");
  row.addTag("Unit", "Celsius");
  row.addValue("LoopCount", loopCount);
  row.addValue("RandomValue", random(10, 40));

  influx.write(row);
  delay(5000);
}

Code for InfluxDB Version 2.x (Version 2.1 specifically for me). Download Arduino library from here.

#include <ESP8266WiFi.h>
#include <ESP8266WiFiMulti.h>
#include <InfluxDb.h>

#define INFLUXDB_URL "http://192.168.1.XXX:8086" // e.g. http://192.168.1.48:8086 (In InfluxDB 2 UI -> Load Data -> Client Libraries), 
#define INFLUXDB_TOKEN "YOUR_TOKEN" // InfluxDB 2 server or cloud API authentication token (Use: InfluxDB UI -> Load Data -> Tokens -> <select token>)
#define INFLUXDB_ORG "influx" // InfluxDB 2 organization id (Use: InfluxDB UI -> Settings -> Profile -> <name under tile> )
#define INFLUXDB_BUCKET "YOUR_BUCKET" // InfluxDB 2 bucket name (Use: InfluxDB UI -> Load Data -> Buckets)
#define WIFI_SSID "YOUR_SSID"
#define WIFI_PASS "YOUR_PASS"
#define MEASUREMENT "esp"
#define DEVICE "esp_04"
#define ID "Development ESP"

ESP8266WiFiMulti WiFiMulti;
InfluxDBClient client(INFLUXDB_URL, INFLUXDB_ORG, INFLUXDB_BUCKET, INFLUXDB_TOKEN);
Point row(MEASUREMENT); // Setup InfluxDB data point

void setup() {
  Serial.begin(9600);
  WiFiMulti.addAP(WIFI_SSID, WIFI_PASS);
  Serial.print("Connecting to WIFI");
  while (WiFiMulti.run() != WL_CONNECTED) {
    Serial.print(".");
    delay(100);
  }
  Serial.println("WiFi connected");
  Serial.println("IP address: ");
  Serial.println(WiFi.localIP());

  if (client.validateConnection()) {          // Checks if can communicate with InfluxDB server
      Serial.print("Connected to InfluxDB: ");
      Serial.println(client.getServerUrl());
  }
  else {
      Serial.print("InfluxDB connection failed: ");
      Serial.println(client.getLastErrorMessage());
  }

  Serial.println("Setup Complete.");
}

int loopCount = 0;

void loop() {
  loopCount++;

  row.clearFields();  // Clear Influx Fields
  row.clearTags();    // Clear Influx Tags
  row.addTag("Device", DEVICE);
  row.addTag("ID", ID);
  row.addField("LoopCount", loopCount);
  row.addField("RandomValue", random(0, 100)); //Helpful for debugging if needed.
  row.addField("25_Value", 20);
  row.addField("50_Value", 50); 
  row.addField("100_Value", 100);     

  Serial.print("Writing: "); // Print what are we exactly writing
  Serial.println(client.pointToLineProtocol(row));

      if (!client.writePoint(row)) {
        Serial.print("InfluxDB write failed: ");
        Serial.println(client.getLastErrorMessage());
      }
      else {
      Serial.println("Wrote data successfully");
      Serial.println("");
      }
  delay(5000);
}

The Arduino Serial Terminal will display something like the below so you can if it is working. (My previous tutorial shows setting up InfluxDB, ensure you have the database “esp8266_test” created as we are going to write to that.)

 --> writing to esp8266_test:
data,Device=ESP8266,Sensor=Temp,Unit=Celsius LoopCount=256.00,RandomValue=37.00
 <-- Response: 204 ""
 --> writing to esp8266_test:
data,Device=ESP8266,Sensor=Temp,Unit=Celsius LoopCount=257.00,RandomValue=20.00
 <-- Response: 204

On the Influx Database we can look at the data by:

influx
USE esp8266_test
select * from data limit 50

Below you can see the export from my database (I have shortened the time field for neatness). You can see I reset the ESP8266 a couple of times due to the LoopCount value.

time        Device  LoopCount RandomValue Sensor Unit    
----        ------  --------- ----------- ------ ----   
52808175073 ESP8266 1         38          Temp   Celsius                              
63108846141 ESP8266 2         35          Temp   Celsius                              
69802517277 ESP8266 1         13          Temp   Celsius                              
79892112240 ESP8266 2         12          Temp   Celsius                              
89961602267 ESP8266 3         14          Temp   Celsius                              
99998928411 ESP8266 4         22          Temp   Celsius                              
10053683452 ESP8266 5         10          Temp   Celsius                              
20120378415 ESP8266 6         28          Temp   Celsius                              
30175745403 ESP8266 7         14          Temp   Celsius                              
40732248123 ESP8266 8         38          Temp   Celsius                              
51232948067 ESP8266 9         15          Temp   Celsius                              
61322347831 ESP8266 10        13          Temp   Celsius                              
71424432515 ESP8266 11        19          Temp   Celsius                              
84740185749 ESP8266 1         18          Temp   Celsius                              
94790343615 ESP8266 2         21          Temp   Celsius                              
04839215465 ESP8266 3         13          Temp   Celsius                              
31864448941 ESP8266 1         32          Temp   Celsius                              
41956355523 ESP8266 2         36          Temp   Celsius                              
52018136222 ESP8266 3         30          Temp   Celsius                              
62083037888 ESP8266 4         22          Temp   Celsius       

That’s it!

Resources I used:

Backup InfluxDB

It makes sense to backup the InfluxDB periodically so we don’t loose all our data.

We can do this in the terminal by:

influxd backup -portable /home/pi/influx_backup/

Make it run every night at 2am by opening crontab and adding the below code:

crontab -e
0 2 * * * influxd backup -portable /home/pi/influx_backup/

Now it would make sense for the above location to be a USB drive etc. as if our main drive fails we would loose the backup along with the original data. We can do this by updating the crontab -e to:

0 2 * * * influxd backup -portable /media/YOUR_USB_DRIVE_NAME

I had to instal the below package to allow the RaspberryPi write to the USB drive:

sudo apt-get install ntfs-3g

Another improvement would be to put all this in a script and push to another machine maybe over FTP but this is as far as I got right now and works well.

We can also see how much data is on the USB Drive by the below, maybe we will log this to Influx in future to keep an eye on backup sizes.

du -sh /media/YOUR_USB_DRIVE_NAME

That’s it!

Grafana Setup on RPi Zero

So you will have InfluxDB installed and data stored in the database, now we are going to visualize this data in Grafana. Click on the images to see the detail.

Install Grafana by:

wget https://raw.githubusercontent.com/trashware/grafana-rpi-zero/master/grafana_6.0.1_armhf.deb

sudo apt-get install adduser libfontconfig

sudo dpkg -i grafana_6.0.1_armhf.deb

sudo update-rc.d grafana-server defaults

sudo service grafana-server start

Grafana will be running now so in a browser you can navigate to the IP of your device, port 3000, for example 192.168.1.2:3000. User and Password is admin. We will create our first graphic later on but now back to the Raspberry Pi.

After a reboot check if Grafana starts up like it should. (mine didn’t)

service grafana-server status

If it does not show as “active (running)” then run the below:

sudo systemctl enable grafana-server.service

Okay now lets start creating a graphic, on a browser go to the device (for example 192.168.1.2:3000) and login, default user and password is admin.

Now we need to add a database, click on the cog wheel and select Data Sources and then click “Add Data Sources”

Setup your database like the below. rpi_01 is the name of the database I created in the previous tutorial. Then Click Save & Test. Everything should work.

Now lets create a graph, go to Dashboard -> Add Panel (top right area) -> Choose Visualization -> Graph. Set up the 4 setting tabs like mine below:

Now you will have a single graph like the top graph of mine below. Read on to understand how to efficiently show the data.

The above graphs all are showing the same data but by far the top graph is the easiest to read. This is displaying a moving average (10 samples) of the mean of the data. The middle graph is displaying moving average (10 samples) of the distinct data values. The bottom chart is just showing distinct values.

Another important setting is the Group By. Grafana only show as much data as it needs if you leave the Group By as time($_interval), otherwise it will fetch far more data than required in long time series and visualizations may fail to load.

Resources Used:
https://www.circuits.dk/install-grafana-influxdb-raspberry/
https://www.neteye-blog.com/2017/02/how-to-tune-your-grafana-dashboards/

RPi Status Log to InfluxDB

In the last post we setup InfluxDB, now we are going to start storing system parameters every minute. It will work out of the box for Raspberry Pi and probably for some other Linux distros.

We are going to log the system uptime, the CPU & GPU Temperatures, the current CPU usage as well as the average CPU usage since boot.

The code is available here or copy from the end of this post. Put the code in a file called soc.sh, don’t forget to update your IP address in the code and make it executable by:

chmod +x soc.sh

We are going to log to database rpi_01, if you don’t have this created already complete the below:

influx
create database rpi_01
exit

Test our script run:

bash soc.sh

To confirm it works we can check the database:

influx
use rpi_01
select * from system_status

and you should see something like: (type exit when you are done)

name: system_status
time   cpu_temp cpu_usage gpu_temp system   system_model   uptime
15329   39.5     14        40.1     RPI-01   ZeroW_V1.1   1386.68

Now we want the system status to be logged every minute, we do this by adding it to crontab:

crontab -e 

Add this line and save and close: (ensure path is correct to your file)

*/1 * * * * /home/pi/influx_scripts/soc.sh

Check back after a while to ensure the logging is happening. In the next post we are going to show the status in graphical form using Grafana like the below:


soc.sh code:

#!/bin/bash
# Gets SOC GPU Temperatures
gpu_temp_0=$(/opt/vc/bin/vcgencmd measure_temp | tr -cd '0-9.')

# Gets System Uptime
uptime=0
uptime=$(awk '{print $1}' /proc/uptime)

# Gets SOC CPU Temperatures
cpu_temp_0=$(cat /sys/class/thermal/thermal_zone0/temp)
cpu_temp_1=$(($cpu_temp_0/1000))
cpu_temp_2=$(($cpu_temp_0/100))
cpu_temp_3=$(($cpu_temp_2 % $cpu_temp_1))
cpu_temp_4=$cpu_temp_1"."$cpu_temp_3

# Converts the total CPU Usage into %
PREV_TOTAL=0
PREV_IDLE=0
Average=0

  for i in {1..6}
  do
  # Since the CPU fluctuates, it discards the first reading and averages the next 5.
  CPU=(`sed -n 's/^cpu\s//p' /proc/stat`) # Discards the cpu prefix
  IDLE=${CPU[3]} 			  # Just the idle CPU time.

  # Calculate the total CPU time.
  TOTAL=0
  for VALUE in "${CPU[@]}"; do
    let "TOTAL=$TOTAL+$VALUE"
  done

  # Calculate the CPU usage since we last checked.
  let "DIFF_IDLE=$IDLE-$PREV_IDLE"
  let "DIFF_TOTAL=$TOTAL-$PREV_TOTAL"
  let "DIFF_USAGE=(1000*($DIFF_TOTAL-$DIFF_IDLE)/$DIFF_TOTAL+5)/10"

  # Remember the total and idle CPU times for the next check.
  PREV_TOTAL="$TOTAL"
  PREV_IDLE="$IDLE"

if [ $i -gt 1 ] # Ignores 1st reading as this is CPU average since boot
    then
	let Average="$DIFF_USAGE+$Average"
fi

  # Wait 1s before checking again.
  sleep 1
done

let Average="$Average/5"

curl -i -XPOST 'http://your.influxDB.ip.address:8086/write?db=rpi_01' --data-binary 'system_status,system=RPI-01,system_model=Insert_Model_Name cpu_usage='$Average',cpu_temp='$cpu_temp_4',gpu_temp='$gpu_temp_0',uptime='$uptime''

Credit to resources I used:
https://hwwong168.wordpress.com/2015/10/12/raspberry-pi-2-gpu-and-cpu-temperature-logger-with-influxdb/

InfluxDB Setup on RPi Zero

InfluxDB is a time series database. The build is robust and straightforward but first lets start with what didn’t work:

  • I could not get Raspbian Buster image to work for the RPi Zero, I reverted to Raspbian Stretch image. Get the image from the Raspberry Pi Archives. Grafana also showed issues on Buster so avoid the headache for now.
wget -qO- https://repos.influxdata.com/influxdb.key | sudo apt-key add -
source /etc/os-release
test $VERSION_ID = "9" && echo "deb https://repos.influxdata.com/debian stretch stable" | sudo tee /etc/apt/sources.list.d/influxdb.list
sudo apt-get update
sudo apt-get install influxdb
sudo service influxdb start
influxd -config /etc/influxdb/influxdb.conf
echo $INFLUXDB_CONFIG_PATH /etc/influxdb/influxdb.conf
influxd
sudo service influxdb restart

Open the file /etc/influxdb/influxdb.conf and ensure the [http] section looks like the below:

sudo nano /etc/influxdb/influxdb.conf
[http]
  # Determines whether HTTP endpoint is enabled.
   enabled = true

  # Determines whether the Flux query endpoint is enabled.
  # flux-enabled = false

  # Determines whether the Flux query logging is enabled.
  # flux-log-enabled = false

  # The bind address used by the HTTP service.
   bind-address = ":8086"

  # Determines whether user authentication is enabled over HTTP/HTTPS.
   auth-enabled = false

InfluxDB is setup and running now but we have no data stored. First we must create a database in InfluxDB, then we can insert data:

influx
create database rpi_01
INSERT system_status,system=RPI-01 cpu_usage=10

We can then view the contents of the database by:

use rpi_01
select * from system_status

You should see and entry like the below in your terminal:

name: system_status
time                cpu_usage system
----                --------- ------
1573332238034530963 10        RPI-01

We are now successfully manually writing to the database, in the next tutorial we will write a script to log the CPU & GPU temperatures of the Raspberry Pi and also the CPU Usage in %.

Credit to resources I used:
https://www.circuits.dk/install-grafana-influxdb-raspberry/
https://github.com/influxdata/docs.influxdata.com/blob/master/content/telegraf/v1.2/introduction/installation.md