Building on the work of others before me, below you will find a tutorial to get PiHole logging to InfluxDB using a python script and then to a Grafana Dashboard. All required code available on my GitHub.
SSH into your PiHole: ssh pi@xxx.xxx.xxx.xxx and run the below:
Install python dependencies:
sudo apt-get install python-influxdb
Create the below python file:
sudo nano influx_scripts/piholestats.py
#! /usr/bin/python
# History:
# 2016: Script originally created by JON HAYWARD: https://fattylewis.com/Graphing-pi-hole-stats/
# 2016 (December) Adapted to work with InfluxDB by /u/tollsjo
# 2016 (December) Updated by Cludch https://github.com/sco01/piholestatus
# 2020 (March) Updated by http://cactusprojects.com/pihole-logging-to-influxdb-&-grafana-dash
import requests
import time
from influxdb import InfluxDBClient
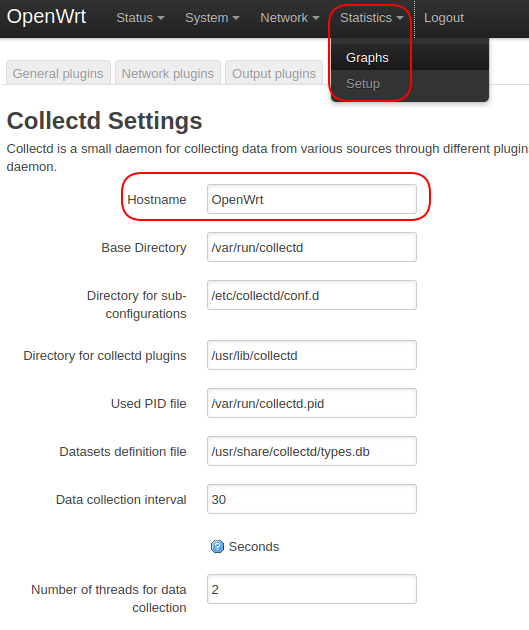
HOSTNAME = "pihole" # Pi-hole hostname to report in InfluxDB for each measurement
PIHOLE_API = "http://192.168.1.XXX/admin/api.php"
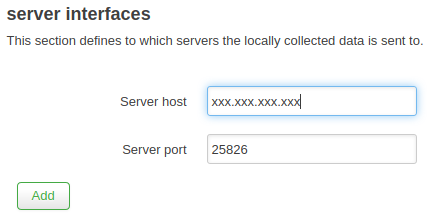
INFLUXDB_SERVER = "192.168.1.XXX" # IP or hostname to InfluxDB server
INFLUXDB_PORT = 8086 # Port on InfluxDB server
INFLUXDB_USERNAME = ""
INFLUXDB_PASSWORD = ""
INFLUXDB_DATABASE = "dev_pihole"
DELAY = 10 # seconds
def send_msg(domains_blocked, dns_queries_today, ads_percentage_today, ads_blocked_today):
json_body = [
{
"measurement": "piholestats." + HOSTNAME.replace(".", "_"),
"tags": {
"host": HOSTNAME
},
"fields": {
"domains_blocked": int(domains_blocked),
"dns_queries_today": int(dns_queries_today),
"ads_percentage_today": float(ads_percentage_today),
"ads_blocked_today": int(ads_blocked_today)
}
}
]
client = InfluxDBClient(INFLUXDB_SERVER, INFLUXDB_PORT, INFLUXDB_USERNAME, INFLUXDB_PASSWORD, INFLUXDB_DATABASE) # InfluxDB host, InfluxDB port, Username, Password, database
# client.create_database(INFLUXDB_DATABASE) # Uncomment to create the database (expected to exist prior to feeding it data)
client.write_points(json_body)
api = requests.get(PIHOLE_API) # URI to pihole server api
API_out = api.json()
#print (API_out) # Print out full data, there are other parameters not sent to InfluxDB
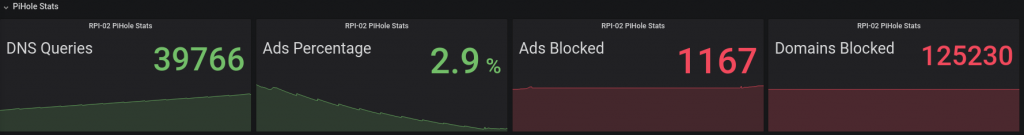
domains_blocked = (API_out['domains_being_blocked'])#.replace(',', '')
dns_queries_today = (API_out['dns_queries_today'])#.replace(',', '')
ads_percentage_today = (API_out['ads_percentage_today'])#
ads_blocked_today = (API_out['ads_blocked_today'])#.replace(',', '')
send_msg(domains_blocked, dns_queries_today, ads_percentage_today, ads_blocked_today)
Save and Exit.
I have the file run on a cron job every minute. Others set it up as a service but cron job works just fine for me:
crontab -e
*/1 * * * * /usr/bin/python /home/pi/influx_scripts/piholestats.py
We need to create Influx database next, I carried this out through the Chronograf web interface but add it through the terminal by the below if required:
influx
create database dev_pihole
exit
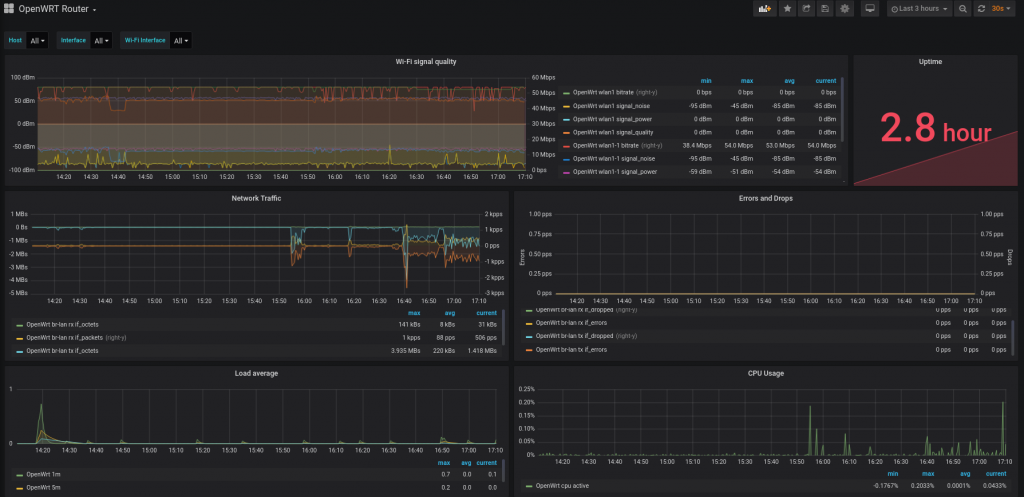
Now onto Grafana Dash:
Add the “dev_pihole” database to the Grafana Data Sources list.
Next go to “Import dashboard” and paste in the JSON code on my Github. I tweaked a previous dashboard slightly.
All done!