This is how I used 3 x DS18B20 digital temperature sensors wired to a RPi. I bought the versions sealed in a casing as plan to put them outdoors. All data handling done in python and being written to InfluxDB and finally displayed on Grafana.
If you want to first familiarise yourself with python and InfuxDB see an earlier post.
Connect the sensors to the RPi as shown below:
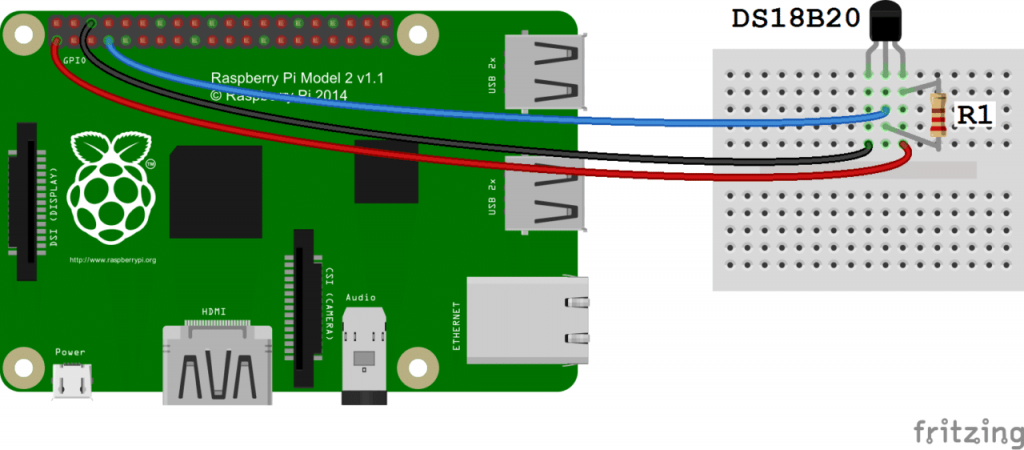
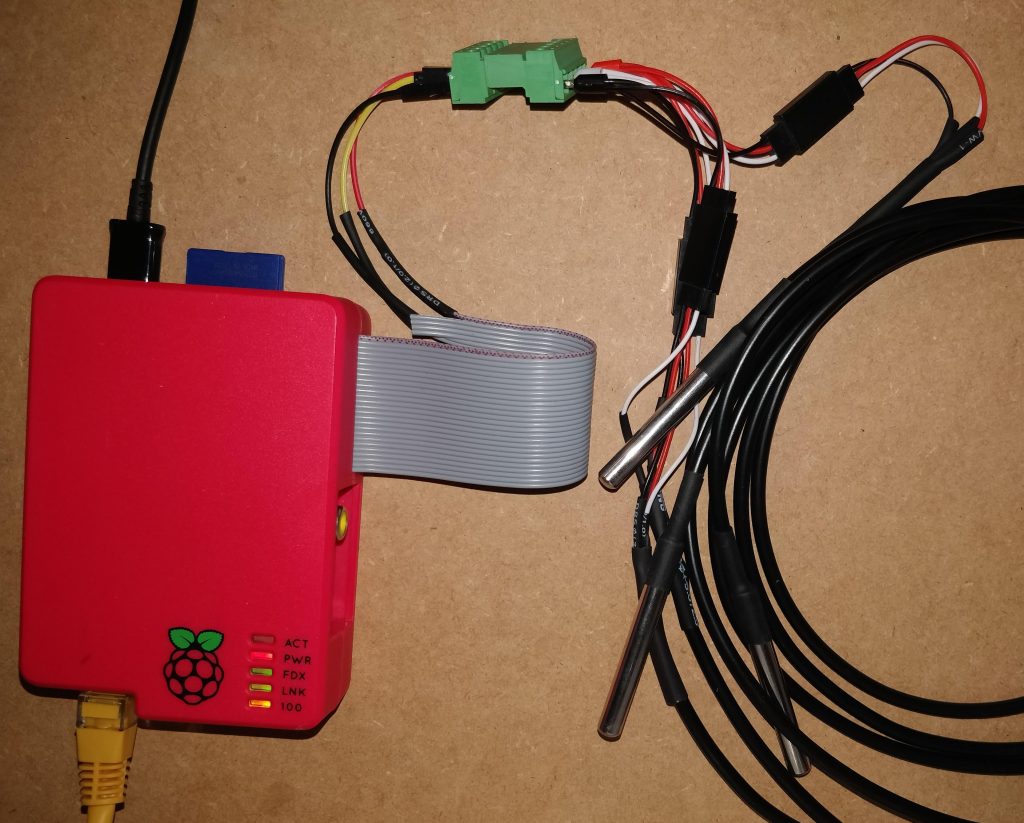
Sensors can be connected in parallel and no extra resistors required. I soldered onto the ribbon cable and used servo connectors to connect each sensor, this would make it easier to pass through glands later on. See my final setup below:
Anyway starting from a fresh install setup the RPi:
sudo apt-get update
sudo apt-get upgrade
sudo apt-get install python-influxdb
Enable the One-Wire interface for the DS18B20 by opening the below file:
sudo nano /boot/config.txt
And add the below to the bottom of the file:
dtoverlay=w1-gpio
Next exit (Ctrl + x) & reboot:
sudo reboot
Next lets see if device detected:
sudo modprobe w1-gpio
sudo modprobe w1-therm
cd /sys/bus/w1/devices
ls
In my case: (when I only connected 1 sensor, the others showed up when connect them)
28-3c01d60708e8 w1_bus_master1
is displayed. Now enter: (change the X’s to your own address or hit tab to auto-fill)
cd 28-XXXXXXXXXXXX
cat w1_slave
The raw temperature reading output by the sensor will be show as below:
4f 01 55 05 7f a5 81 66 3b : crc=3b YES
4f 01 55 05 7f a5 81 66 3b t=20937
Here the temperature reading is t=20937, which means a temperature of 20.937 degrees Celsius.
Great so we are reading a single sensor fine, lets create a python file to do all the above for us:
cd /home/pi
nano temp.py
Fill the file with the below: Remember to update the below:
– The IP of your InfluxDB instance along with database details.
– The address of your DS18B20 sensors
import os
import glob
import time

os.system('modprobe w1-gpio')
os.system('modprobe w1-therm')

from influxdb import InfluxDBClient
client = InfluxDBClient(host='192.168.1.XXX', port=8086)
#client.get_list_database()
client.switch_database('YOUR_DATABASE')

sensor_1 = '/sys/bus/w1/devices/28-3c01d60708e8/w1_slave'
sensor_2 = '/sys/bus/w1/devices/28-3c01d60711da/w1_slave'
sensor_3 = '/sys/bus/w1/devices/28-3c01d6072d92/w1_slave'

sensor_1_t = 0
sensor_2_t = 0
sensor_3_t = 0

def read_temp(sensor):
    f = open(sensor, 'r')
    lines = f.readlines()
    f.close()

    equals_pos = lines[1].find('t=')
    if equals_pos != -1:
        temp_string = lines[1][equals_pos+2:]
        temp_c = float(temp_string) / 1000.0
        return temp_c

sensor_1_t = read_temp(sensor_1)
sensor_2_t = read_temp(sensor_2)
sensor_3_t = read_temp(sensor_3)

print("Sensor 1 (Inside Shed): " + str(sensor_1_t))
print("Sensor 2 (Outside): " + str(sensor_2_t))
print("Sensor 3 (Soil): " + str(sensor_3_t))

json_body = [
    {
        "measurement": "YOUR_MEASUREMENT",
        "tags": {
            "Device": "YOUR_DEVICE",
            "ID": "YOUR_ID"
        },
        "fields": {
            "i_temp": sensor_1_t,
            "o_temp": sensor_2_t,
            "s_temp": sensor_3_t
        }
    }
]
client.write_points(json_body)
Exit the nano editor while saving using Ctrl + x and hitting Y to save. Make the file executable:
chmod +x temp.py
Run the python file:
python temp.py
Data will be written to your database along with the text outputted to the console. Okay now lets get it to run/log every 15mins by:
crontab -e
*/15 * * * * /usr/bin/python /home/pi/temp.py
Ctrl + x to exit
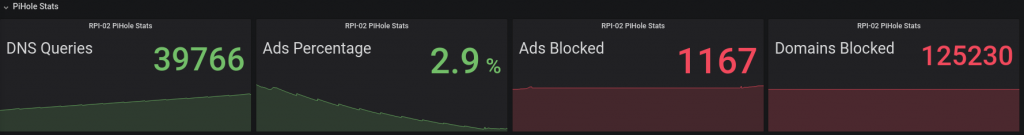
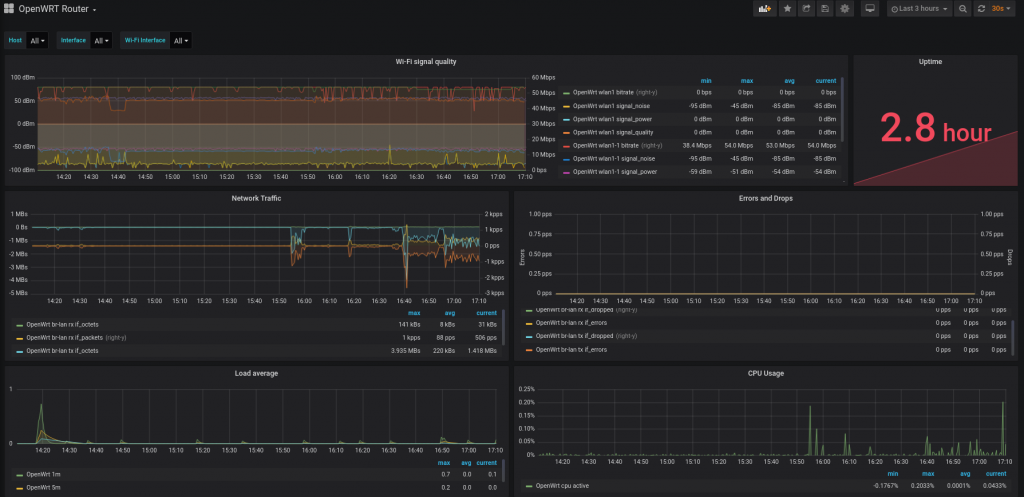
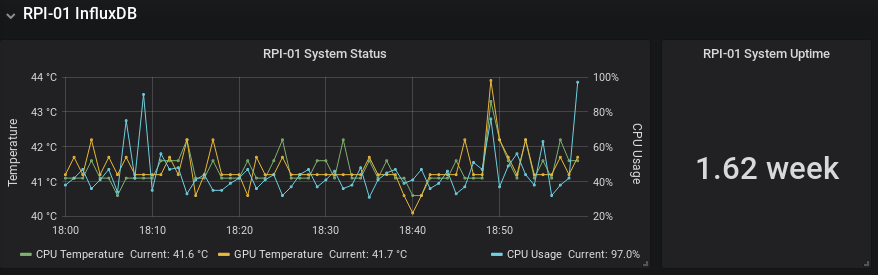
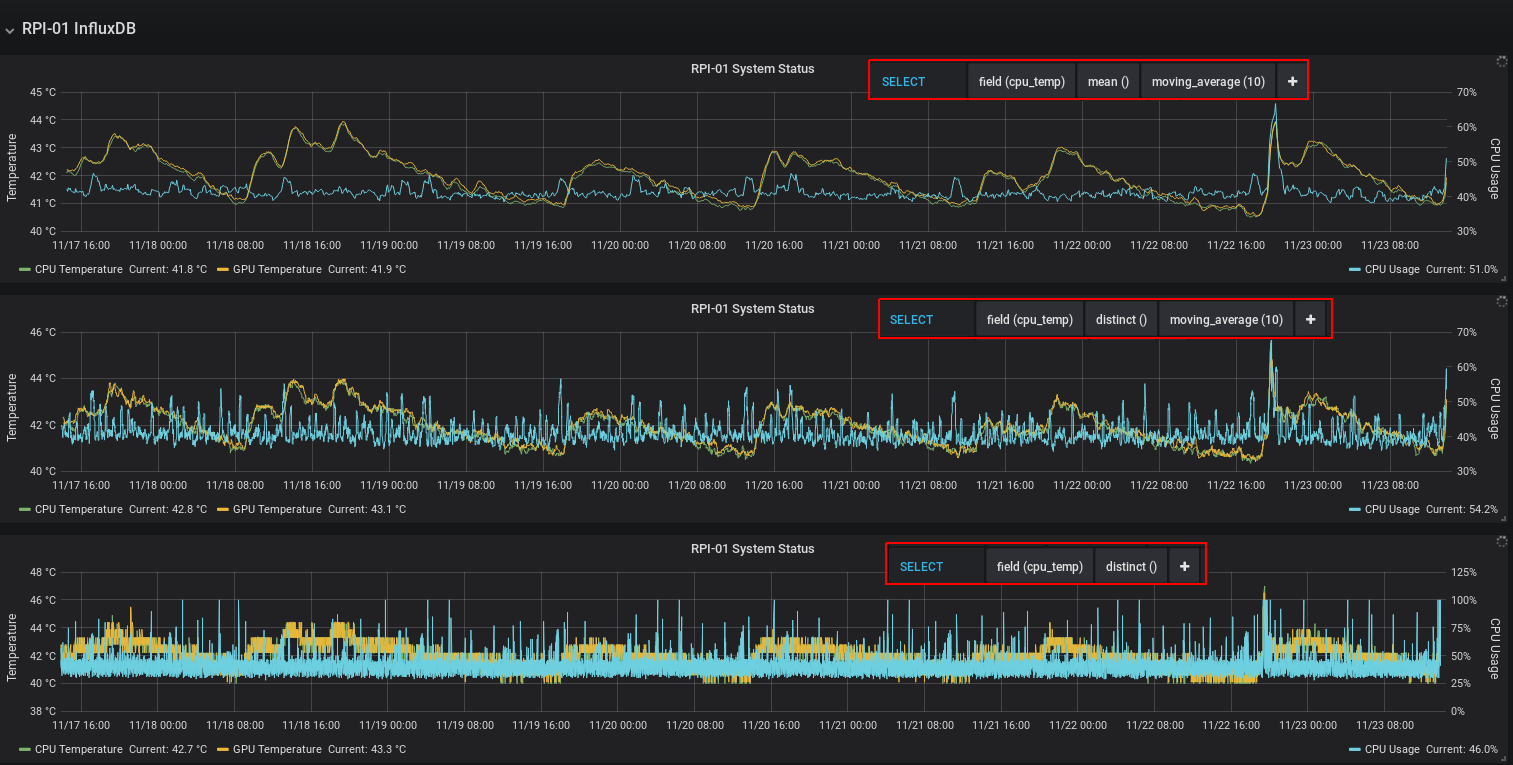
I then setup a Grafana display to show the sensors (all in the same location for now)
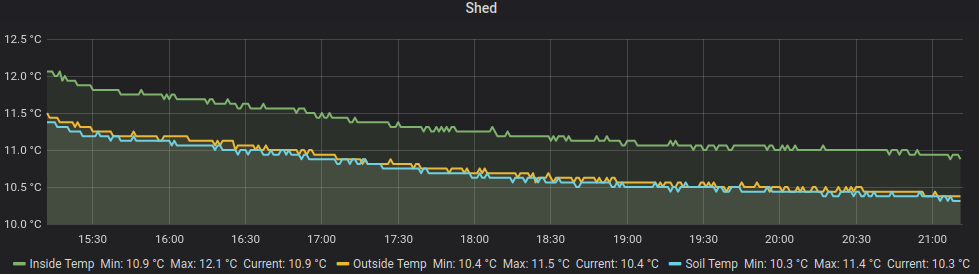
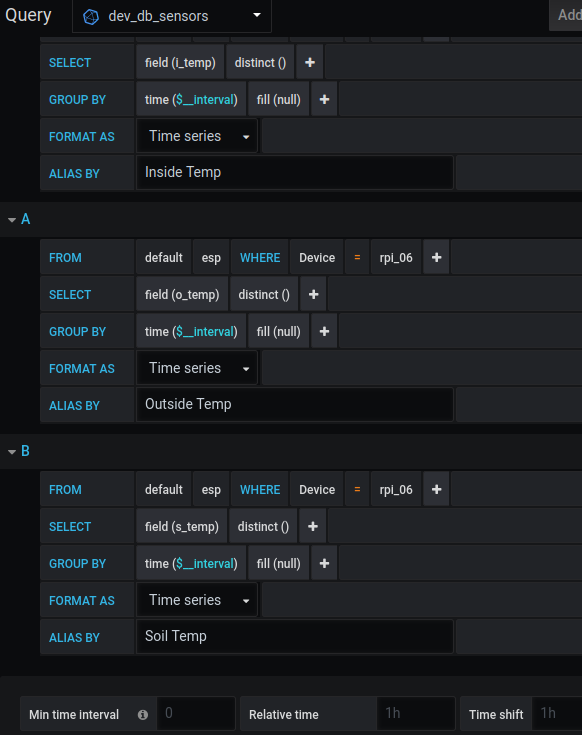
That’s it!
Resources I used:
https://www.circuitbasics.com/raspberry-pi-ds18b20-temperature-sensor-tutorial/