Installing InfluxDB Ver 2 on RPi4

So my image running InfuxDB became corrupted and I was unable to recover so I decided to take the jump to InfluxDB 2.x.

The days of the TICK stack are gone and all contained now in a single Influx install.

Start with a fresh install of 64-Bit Ubuntu Server. (tutorial here)

Note: With Influx version 2.x there is a new protocol for writing data and essentially an upgrade to 2.x will mean all devices writing to Influx will need their code updated also. . . . . fun. Also Grafana should be updated to version 7.x+ if you also run this side by side, even more fun.

sudo apt-get update
sudo apt-get upgrade -y

wget -qO- https://repos.influxdata.com/influxdb.key | gpg --dearmor | sudo tee /etc/apt/trusted.gpg.d/influxdb.gpg > /dev/null

export DISTRIB_ID=$(lsb_release -si); export DISTRIB_CODENAME=$(lsb_release -sc)

echo "deb [signed-by=/etc/apt/trusted.gpg.d/influxdb.gpg] https://repos.influxdata.com/${DISTRIB_ID,,} ${DISTRIB_CODENAME} stable" | sudo tee /etc/apt/sources.list.d/influxdb.list > /dev/null

sudo apt-get update && sudo apt-get install influxdb2

sudo apt-get install fail2ban -y; sudo apt-get install ntp -y; sudo apt-get install ntpstat -y

#Did not use hashed out commands yet, was required on raspbian but not sure about ubuntu
#systemctl stop systemd-timesyncd
#systemctl disable systemd-timesyncd
#/etc/init.d/ntp stop
#/etc/init.d/ntp start

sudo reboot

Confirm everything is working:

sudo service influxdb status
ntpstat

You can also head to the InfluxDB configuration page on: http://192.168.1.xxx:8086

Further work if upgrading from InfluxDB 1.x to 2.x

  • Update devices running Shell scrips / .sh code
  • Update devices running Python .py code
  • Update Arduino/ESP devices running .ino code

That’s it!

Resources I used:

  • https://ubuntu.com/tutorials/how-to-install-ubuntu-on-your-raspberry-pi#1-overview
  • https://docs.influxdata.com/influxdb/v2.1/install/?t=Linux
Using DS18B20 on RPi (python) w/bonus writing to InfluxDB

This is how I used 3 x DS18B20 digital temperature sensors wired to a RPi. I bought the versions sealed in a casing as plan to put them outdoors. All data handling done in python and being written to InfluxDB and finally displayed on Grafana.

If you want to first familiarise yourself with python and InfuxDB see an earlier post.

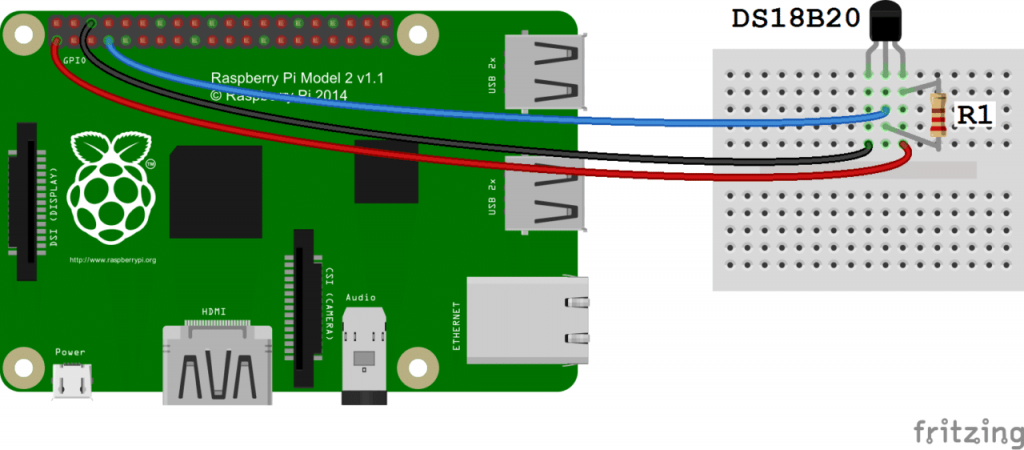
Connect the sensors to the RPi as shown below:

Image Source: Scott Campbell https://www.circuitbasics.com/raspberry-pi-ds18b20-temperature-sensor-tutorial/

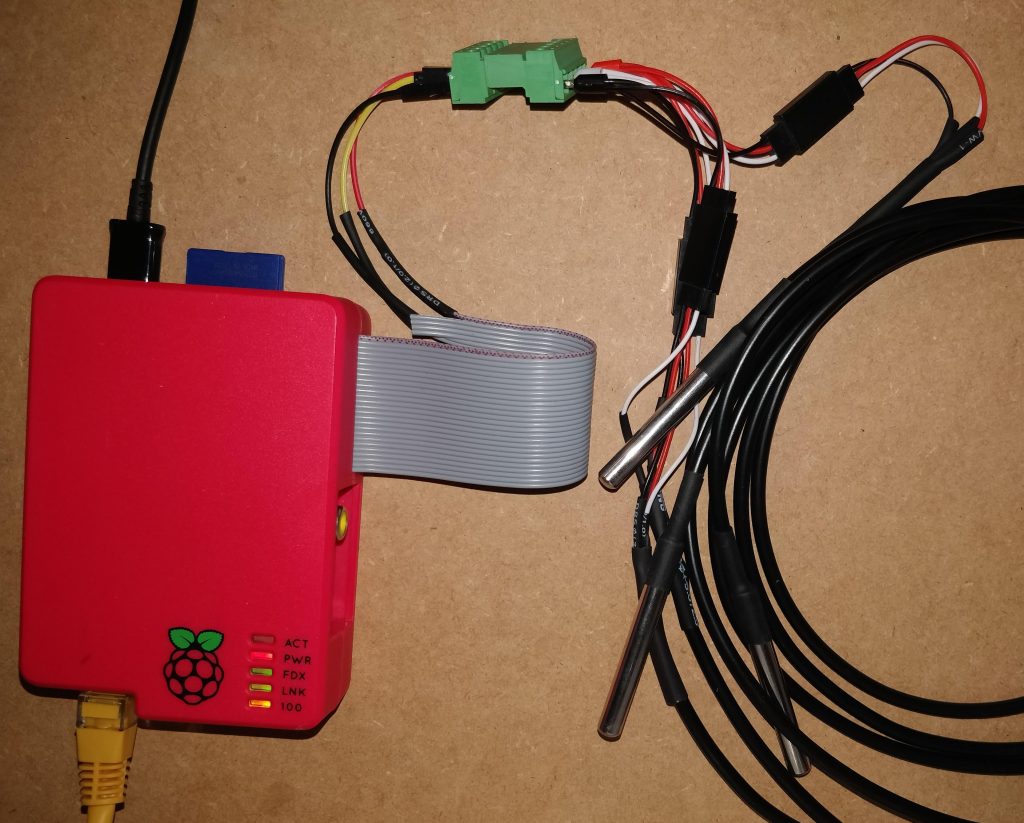
Sensors can be connected in parallel and no extra resistors required. I soldered onto the ribbon cable and used servo connectors to connect each sensor, this would make it easier to pass through glands later on. See my final setup below:

Anyway starting from a fresh install setup the RPi:

sudo apt-get update
sudo apt-get upgrade
sudo apt-get install python-influxdb

Enable the One-Wire interface for the DS18B20 by opening the below file:

sudo nano /boot/config.txt

And add the below to the bottom of the file:

dtoverlay=w1-gpio

Next exit (Ctrl + x) & reboot:

sudo reboot

Next lets see if device detected:

sudo modprobe w1-gpio
sudo modprobe w1-therm
cd /sys/bus/w1/devices
ls

In my case: (when I only connected 1 sensor, the others showed up when connect them)

28-3c01d60708e8 w1_bus_master1

is displayed. Now enter: (change the X’s to your own address or hit tab to auto-fill)

cd 28-XXXXXXXXXXXX
cat w1_slave

The raw temperature reading output by the sensor will be show as below:

4f 01 55 05 7f a5 81 66 3b : crc=3b YES
4f 01 55 05 7f a5 81 66 3b t=20937

Here the temperature reading is t=20937, which means a temperature of 20.937 degrees Celsius.

Great so we are reading a single sensor fine, lets create a python file to do all the above for us:

cd /home/pi
nano temp.py

Fill the file with the below: Remember to update the below:
– The IP of your InfluxDB instance along with database details.
– The address of your DS18B20 sensors

import os
import glob
import time

os.system('modprobe w1-gpio')
os.system('modprobe w1-therm')

from influxdb import InfluxDBClient
client = InfluxDBClient(host='192.168.1.XXX', port=8086)
#client.get_list_database()
client.switch_database('YOUR_DATABASE')

sensor_1 = '/sys/bus/w1/devices/28-3c01d60708e8/w1_slave'
sensor_2 = '/sys/bus/w1/devices/28-3c01d60711da/w1_slave'
sensor_3 = '/sys/bus/w1/devices/28-3c01d6072d92/w1_slave'

sensor_1_t = 0
sensor_2_t = 0
sensor_3_t = 0

def read_temp(sensor):
    f = open(sensor, 'r')
    lines = f.readlines()
    f.close()

    equals_pos = lines[1].find('t=')
    if equals_pos != -1:
        temp_string = lines[1][equals_pos+2:]
        temp_c = float(temp_string) / 1000.0
        return temp_c

sensor_1_t = read_temp(sensor_1)
sensor_2_t = read_temp(sensor_2)
sensor_3_t = read_temp(sensor_3)

print("Sensor 1 (Inside Shed): " + str(sensor_1_t))
print("Sensor 2 (Outside): " + str(sensor_2_t))
print("Sensor 3 (Soil): " + str(sensor_3_t))

json_body = [
    {
        "measurement": "YOUR_MEASUREMENT",
        "tags": {
            "Device": "YOUR_DEVICE",
            "ID": "YOUR_ID"
        },
        "fields": {
            "i_temp": sensor_1_t,
            "o_temp": sensor_2_t,
            "s_temp": sensor_3_t
        }
    }
]
client.write_points(json_body)

Exit the nano editor while saving using Ctrl + x and hitting Y to save. Make the file executable:

chmod +x temp.py

Run the python file:

python temp.py

Data will be written to your database along with the text outputted to the console. Okay now lets get it to run/log every 15mins by:

crontab -e
*/15 * * * * /usr/bin/python /home/pi/temp.py

Ctrl + x to exit

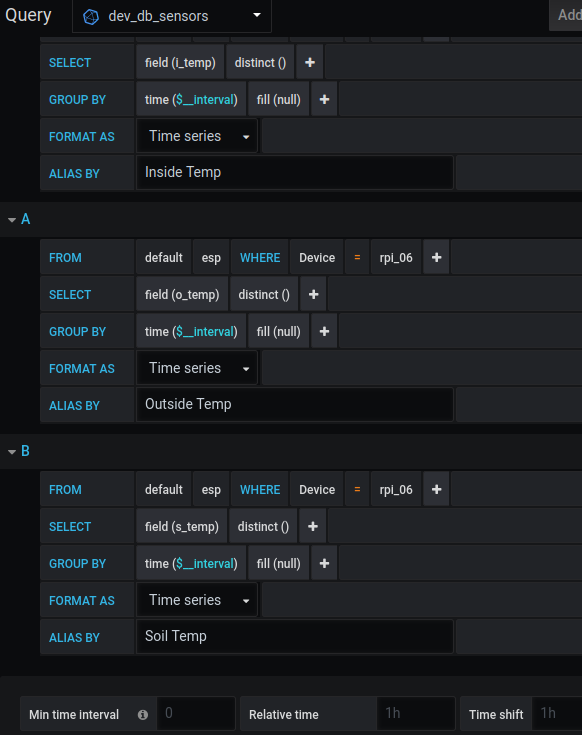
I then setup a Grafana display to show the sensors (all in the same location for now)

Settings used for above display.

That’s it!

Resources I used:
https://www.circuitbasics.com/raspberry-pi-ds18b20-temperature-sensor-tutorial/

Python (RPi) logging to InfluxDB

Simple way to test that you can write to InfluxDB on a RaspberryPi using python. I decided to document as it’s a prerequisite for a later project.

Starting from a fresh install setup the RPi:

sudo apt-get update
sudo apt-get upgrade
sudo apt-get install python-influxdb

It is assumed you have a database ready to go but if not, log into the Device/RPi hosting InfluxDB and create as per below:

influx
create database YOUR_DATABASE
exit

Anyway back to our other device, create a python file:

cd /home/pi
nano test.py

Fill the file with the below:

from influxdb import InfluxDBClient
client = InfluxDBClient(host='192.168.1.XXX', port=8086)
#client.get_list_database() # Use this line if you want to read databases available
client.switch_database('YOUR_DATABASE')

json_body = [
    {
        "measurement": "YOUR_MEASUREMENT_TABLE",
        "tags": {          #Example Tags
            "Device": "Test_Device",
            "ID": "Test_Temperature"
        },
        "fields": {        #Example Fields
            "i_temp": 19,
            "o_temp": 20,
            "s_temp": 21
        }
    }
]

client.write_points(json_body)

Exit the nano editor while saving using Ctrl + x and hitting Y to save. Make the file executable:

chmod +x test.py

Run the python file:

python test.py

Data will be written to your database, if required you can check this on your device hosting InfluxDB by:

influx
use YOUR_DATABASE
select * from YOUR_MEASUREMENT_TABLE

That’s it!

Resources I used:
https://www.circuitbasics.com/raspberry-pi-ds18b20-temperature-sensor-tutorial/

IOT Geiger Counter (InfluxDB)

Of course every household needs a Geiger Counter and I bought this kit to do all the fancy 400/500V voltage work along with an SBM-20 Geiger-Muller Tube on eBay for the actual radiation detecting. Typically it seems people hook this up to a tablet etc. and run an app but my plan was to log to InfluxDB. It can also operate stand-alone which is why I added a handy display (Nokia 5110).

Finished IOT Geiger Counter

Notes:
This type of detector is designed to detect Beta & Gamma rays. (it cannot detect Alpha rays but this sensor can be added easily if wanted.

What it does:
– Listens & counts pulses for 60 seconds
– After 60 seconds writes this value to InfluxDB
– Updates display with current metrics. (last 60 second reading, average reading, max reading, estimated dosage & the current IP address)

Connecting it up:

LCD PinESP8266 Labelled PinESP8266 GPIO PinGeiger Detector Board
1 – RSTD0GPIO 16
2 – CED1GPIO 5
3 – DCD2GPIO 4
4 – DIND3GPIO 0
5 – CLKD4GPIO 2
6 – Vcc3.3V3.3V
7 – Backlight3.3V (on)3.3V
8 – GroundGroundGroundGround
D5GPIO 14Int (interrupt)
VU/ 5VVU / 5V5V

Code:
See latest code at my GitHub (or below):
– Requires Adafruit libraries. Link 1, Link 2
– Requires Running Average Library
– Requires InfluxDb library

#include <ESP8266WiFi.h>
#include <InfluxDb.h>
#include <SPI.h>
#include <Adafruit_GFX.h>
#include <Adafruit_PCD8544.h>
#include "RunningAverage.h"

#define INFLUXDB_HOST "192.168.1.XXX"
#define WIFI_SSID "XXXXXXXXXXXX"
#define WIFI_PASS "XXXXXXXXXXXX"
#define DATABASE "XXXXXXXXXXXX"
#define MEASUREMENT "XXXXXXXXXXXX"
#define DEVICE "XXXXXXXXXXXX"
#define ID "Geiger_Counter"
#define LOG_PERIOD 60000

Influxdb influx(INFLUXDB_HOST);
Adafruit_PCD8544 display = Adafruit_PCD8544(2, 0, 4, 5, 16); //LCD 1.5 Inch (Nokia 5110)84×48 (x,y) pixels
RunningAverage raMinute(60);

//################
int debug = 1; //#
//################

int loopCount = 0;
int cpm = 0;
int cpm_max = 0;
int cpm_1hr_avg = 0;
int cpm_ravg = 0;
int counts = 0;
int cal_factor = 1;
int wifiStatus;

unsigned long currentMillis;
unsigned long previousMillis; //variable for time measurement

void setup(){                                               
  Serial.begin(9600);      // start serial monitor
  delay(1000);
  Serial.println("");
  Serial.println("");
  Serial.println("Setup Routine of ESP8266 Geiger Counter");

  display.begin();
  display.setContrast(55);
  display.display();        // show adafruid splashscreen
  delay(2000);
  display.clearDisplay();   // clears the screen and buffer

  pinMode(LED_BUILTIN, OUTPUT); //D4
  digitalWrite(LED_BUILTIN, HIGH); //Turns it off

  pinMode(14, INPUT_PULLUP);                  // set pin INT0 input for capturing GM Tube events / GPIO5 = D1
  attachInterrupt(14, tube_pulse, FALLING); //defines interrupts

  raMinute.clear();

  influx.setDb(DATABASE);

  display.setTextSize(1);
  display.setTextColor(BLACK);
  display.setCursor(0,0); display.setTextSize(1);display.print("Up Hrs: ");display.setCursor(48,0);display.print("0");
  display.setCursor(0,9); display.setTextSize(1);display.print("CPMi 1m:");
  display.setCursor(0,17);display.setTextSize(1);display.print("CPM avg:");
  display.setCursor(0,25);display.setTextSize(1);display.print("CPM Max:");
  display.setCursor(0,33);display.setTextSize(1);display.print("uSv/hr: ");
  display.setCursor(0,41);display.setTextSize(1);display.print("Not Connected");
  display.display();

    wifiStatus = WiFi.status();
    if (wifiStatus != WL_CONNECTED) {   
      new_connection();
    }
    else {
        display.fillRect(0,41,84,48, WHITE);
        display.setCursor(0,41);
        display.print(WiFi.localIP());
        display.display();
    }
    

  if (debug == 1) {Serial.println("Setup Complete.");}
}

void loop(){                                              
  currentMillis = millis();
  if(currentMillis - previousMillis > LOG_PERIOD){
    cpm = counts * cal_factor;                        

    raMinute.addValue(cpm);
    cpm_ravg = raMinute.getAverage();

    if (cpm > cpm_max){
      cpm_max = cpm;
    }
    
    Serial.print("CPM: ");                         
    Serial.println(cpm);                          

    display.fillRect(48,0,40,40, WHITE);
    display.display();
    display.setCursor(48,0);display.print(loopCount*.0166);
    display.setCursor(48,9);display.print(cpm);
    display.setCursor(48,17);display.print(cpm_ravg);
    display.setCursor(48,25);display.print(cpm_max);
    display.setCursor(48,33);display.print(cpm_ravg*0.0057);
    display.display();

    Serial.println("Attempting to write to DB");   
    counts = 0;

    InfluxData row(MEASUREMENT);
    row.addTag("Device", DEVICE);
    row.addTag("ID", ID);
    row.addValue("CPM", cpm);  
    row.addValue("LoopCount", loopCount);
    row.addValue("RandomValue", random(0, 100));
  
    wifiStatus = WiFi.status();
    while ( wifiStatus != WL_CONNECTED )
        {
          new_connection();
        }
  
    influx.write(row);
    if (debug == 1) {Serial.println("Wrote Data.");}
  
    //WiFi.mode(WIFI_OFF); // Probably turn off Wifi if want to save battery
    //WiFi.forceSleepBegin();
    //delay( 1 );
  
    status_blink();
    previousMillis = currentMillis;
    loopCount++;
  }
}

ICACHE_RAM_ATTR        //Needed to fix ISR not in IRAM boot error
void tube_pulse(){     //procedure for capturing events from interrupt
  counts++;
}

void new_connection() {
  
    wifiStatus = WiFi.status();
    
    if (wifiStatus != WL_CONNECTED) {   
       
        WiFi.mode(WIFI_STA);
        WiFi.begin(WIFI_SSID, WIFI_PASS);
        int loops = 0;
        int retries = 0;
        display.fillRect(0,41,84,48, WHITE);
        display.setCursor(0,41);
        display.print("Not Connected");
        display.display();
       
        while (wifiStatus != WL_CONNECTED)
        {
          retries++;
          if( retries == 300 )
          {
              if (debug == 1) {Serial.println( "No connection after 300 steps, powercycling the WiFi radio. I have seen this work when the connection is unstable" );}
              WiFi.disconnect();
              delay( 10 );
              WiFi.forceSleepBegin();
              delay( 10 );
              WiFi.forceSleepWake();
              delay( 10 );
              WiFi.begin( WIFI_SSID, WIFI_PASS );
          }
          if ( retries == 600 )
          {
              if (debug == 1) {Serial.println( "No connection after 600 steps. WiFi connection failed, disabled WiFi and waiting for a minute" );}
              WiFi.disconnect( true );
              delay( 1 );
              WiFi.mode( WIFI_OFF );
              WiFi.forceSleepBegin();
              delay( 10 );
              retries = 0;
              
              if( loops == 3 )
              {
                  if (debug == 1) {Serial.println( "That was 3 loops, still no connection so let's go to deep sleep for 2 minutes" );}
                  Serial.flush();
                  ESP.deepSleep( 120000000, WAKE_RF_DISABLED );
              }     
          }
          delay(50);
          wifiStatus = WiFi.status();
        }
        
        wifiStatus = WiFi.status();
        Serial.print("WiFi connected, IP address: ");Serial.println(WiFi.localIP());
        display.fillRect(0,41,84,48, WHITE);
        display.setCursor(0,41);
        display.print(WiFi.localIP());
        display.display();
    }
}

void status_blink() {
  digitalWrite(LED_BUILTIN, LOW);   // Turn the LED on (Note that LOW is the voltage level   
  delay(100);
  digitalWrite(LED_BUILTIN, HIGH);   // Turn the LED on (Note that LOW is the voltage level
  delay(100);
  digitalWrite(LED_BUILTIN, LOW);   // Turn the LED on (Note that LOW is the voltage level   
  delay(100);
  digitalWrite(LED_BUILTIN, HIGH);   // Turn the LED on (Note that LOW is the voltage level
}

ToDo:
– Comment code
– Add in check at start of code to see if tube functioning.
– I would like to update the running average to 60min average but not enough time to currently do these 10 lines of code.
– Add in control (on/off ) for the LCD backlight, buzzer & Wifi for battery consumption.
– Perhaps would be nice to log to SD card also, not sure if I still have enough I/O for that.
– The ‘case’ is a very rough and not worthy of sharing, a nicer more bespoke would be ideal.
– Add radiation symbol on splash screen.

Resources I used:
https://mightyohm.com/blog/2014/11/a-spotters-guide-to-the-sbm-20-geiger-counter-tube/

That’s it!

Complete Influx Ver. 1.x TICK Stack Disaster Recovery

Note: This only works for Version 1.x (1.6 specifically for me), I have since upgraded to Version 2.x.

My entire system became corrupt one day and while it was technically booting it was not functioning. I did not have proper backups so the road to recovery was long & painful. I now have better emphasis on backups.

Typically all Influx data is backed up by:

influxd backup -portable /media/usb/drive

and restored with

influxd restore -portable /media/usb/drive

I did not have this luxury so I started with copying all the main files to and external drive, these were:

/var/lib/influxdb/data
/var/lib/influxdb/wal
/var/lib/influxdb/meta
/var/lib/kapacitor/kapacitor.db

Okay we are now finished with the corrupted image, do a full fresh install of your system. (tutorial)

Great we are now all setup, insert USB where files were backed up to before. We need to find the UUID of the USB and then edit fstab to mount the USB automatically:

ls -l /dev/disk/by-uuid/
sudo nano /etc/fstab

Add below line to fstab: (edit UUID for your device)

UUID=18A9-9943 /media/usb vfat auto,nofail,noatime,users,rw,uid=pi,gid=pi 0 0

Now we need to tell Influx config to look at memory stick, edit the below file with:

[meta]
  #dir = "/var/lib/influxdb/meta"
  dir = "/media/usb/drive/meta"

[data]
  #dir = "/var/lib/influxdb/data"
  dir = "/media/usb/drive/data"

  #wal-dir = "/var/lib/influxdb/wal"
  wal-dir = "/media/usb/drive/wal"

I also needed to change the user of the files on the USB by:

sudo chown -R influxdb:influxdb /media/usb/drive

We will revert some of the above changes later on.
Note: My original plan was to have all files on the USB drive permanently but as soon as I added the data source in Chronograf everything broke so I undid this. I just used this step to export the data properly.

Reboot system.

Now all your old data should be loaded.

Now we will create a proper backup of the data with the below:

influxd backup -portable /media/usb/drive

Revert all changes in the influxdb.conf file:

sudo nano /etc/influxdb/influxdb.conf 

Now restore all data back to the default locations by:

influxd restore -portable /media/usb/drive

Since it took me a few days to figure out how to restore data I already had the system back up recording data, the above restore does not work if a database is already created so I had to side-load all databases in with:

influxd
CREATE DATABASE my_data_bak
USE my_data_bak
SELECT * INTO my_data..:MEASUREMENT FROM /.*/ GROUP BY *
DROP DATABASE my_data_bak
exit

Finally add back in your Chronograf alerts etc. by:

sudo mv /var/lib/kapacitor/kapacitor.db /var/lib/kapacitor/kapacitor_orig.db 
sudo mv /media/usb/drive/kapacitor.db /var/lib/kapacitor/
sudo chown -R kapacitor:kapacitor /var/lib/kapacitor/kapacitor.db

Future planning would be to keep regular backups with: (you need to do this individually for all databases). See my other post on this.

influxd backup -portable /media/usb-influx/backup
kapacitor backup /media/usb/drive/kapacitor.db

Reboot and we are done!

Resources used to create this page:

Installing TICK Stack on RPi4 (InfluxDB Ver 1.6)

Nothing complicated this time, just commands I use to setup my Influx TICK stack from fresh install.

I’ve since migrated to InfluxDB version 2.x so see set-up for that here.

sudo apt-get update
sudo apt-get upgrade
wget -qO- https://repos.influxdata.com/influxdb.key | sudo apt-key add -
source /etc/os-release
test $VERSION_ID = "10" && echo "deb https://repos.influxdata.com/debian buster stable" | sudo tee /etc/apt/sources.list.d/influxdb.list
sudo apt-get install influxdb
sudo apt install influxdb-client
sudo apt-get update
sudo apt-get install telegraf
sudo apt-get install chronograf
sudo apt-get install kapacitor
sudo systemctl unmask influxdb.service 
sudo systemctl start influxdb 
sudo apt-get install fail2ban
sudo apt-get install ntp
sudo apt-get install ntpstat
systemctl stop systemd-timesyncd
systemctl disable systemd-timesyncd
/etc/init.d/ntp stop
/etc/init.d/ntp start
sudo reboot

Confirm everything is working:

sudo service kapacitor status
sudo service chronograf status
sudo service influxdb status
sudo service telegraf status
ntpstat

You can also head to the Chronograf configuration page on: http://192.168.1.xxx:8888

That’s it!

Overwrite InfluxDB point

I had an issue where I had spurious high values reported to one of my databases and I didn’t have time to debug for a while so I ended up overwriting the point about once a week. I couldn’t find a way to delete the measurement completely but overwriting works well:

Launch Influx CLI:

 influx

Select your database:

 use dev_db

Find the point you want, for me it was always the max value:

SELECT max("Energy_Usage") FROM "esp" WHERE ("Device" = 'esp_03') 

The result returned was:

name: esp
time                max
----                ---
1583863516000000000 1049397312

Now we take the time returned from above and rewrite over the point in the database, (I overwrote it with a value of 150:

INSERT esp,Device=esp_03 Energy_Usage=150 1583863516000000000

That’s it!

PiHole logging to InfluxDB & Grafana Dash

Building on the work of others before me, below you will find a tutorial to get PiHole logging to InfluxDB using a python script and then to a Grafana Dashboard. All required code available on my GitHub.

SSH into your PiHole: ssh pi@xxx.xxx.xxx.xxx and run the below:

Install python dependencies:

sudo apt-get install python-influxdb

Create the below python file:

sudo nano influx_scripts/piholestats.py
#! /usr/bin/python

# History:
# 2016: Script originally created by JON HAYWARD: https://fattylewis.com/Graphing-pi-hole-stats/
# 2016 (December) Adapted to work with InfluxDB by /u/tollsjo
# 2016 (December) Updated by Cludch https://github.com/sco01/piholestatus
# 2020 (March) Updated by http://cactusprojects.com/pihole-logging-to-influxdb-&-grafana-dash

import requests
import time
from influxdb import InfluxDBClient

HOSTNAME = "pihole" # Pi-hole hostname to report in InfluxDB for each measurement
PIHOLE_API = "http://192.168.1.XXX/admin/api.php"
INFLUXDB_SERVER = "192.168.1.XXX" # IP or hostname to InfluxDB server
INFLUXDB_PORT = 8086 # Port on InfluxDB server
INFLUXDB_USERNAME = ""
INFLUXDB_PASSWORD = ""
INFLUXDB_DATABASE = "dev_pihole"
DELAY = 10 # seconds

def send_msg(domains_blocked, dns_queries_today, ads_percentage_today, ads_blocked_today):

	json_body = [
	    {
	        "measurement": "piholestats." + HOSTNAME.replace(".", "_"),
	        "tags": {
	            "host": HOSTNAME
	        },
	        "fields": {
	            "domains_blocked": int(domains_blocked),
                    "dns_queries_today": int(dns_queries_today),
                    "ads_percentage_today": float(ads_percentage_today),
                    "ads_blocked_today": int(ads_blocked_today)
	        }
	    }
	]

	client = InfluxDBClient(INFLUXDB_SERVER, INFLUXDB_PORT, INFLUXDB_USERNAME, INFLUXDB_PASSWORD, INFLUXDB_DATABASE) # InfluxDB host, InfluxDB port, Username, Password, database
	# client.create_database(INFLUXDB_DATABASE) # Uncomment to create the database (expected to exist prior to feeding it data)
	client.write_points(json_body)

api = requests.get(PIHOLE_API) # URI to pihole server api
API_out = api.json()

#print (API_out) # Print out full data, there are other parameters not sent to InfluxDB

domains_blocked = (API_out['domains_being_blocked'])#.replace(',', '')
dns_queries_today = (API_out['dns_queries_today'])#.replace(',', '')
ads_percentage_today = (API_out['ads_percentage_today'])#
ads_blocked_today = (API_out['ads_blocked_today'])#.replace(',', '')

send_msg(domains_blocked, dns_queries_today, ads_percentage_today, ads_blocked_today)

Save and Exit.

I have the file run on a cron job every minute. Others set it up as a service but cron job works just fine for me:

crontab -e
*/1 * * * * /usr/bin/python /home/pi/influx_scripts/piholestats.py

We need to create Influx database next, I carried this out through the Chronograf web interface but add it through the terminal by the below if required:

influx
create database dev_pihole
exit

Now onto Grafana Dash:

Add the “dev_pihole” database to the Grafana Data Sources list.

Next go to “Import dashboard” and paste in the JSON code on my Github. I tweaked a previous dashboard slightly.

All done!

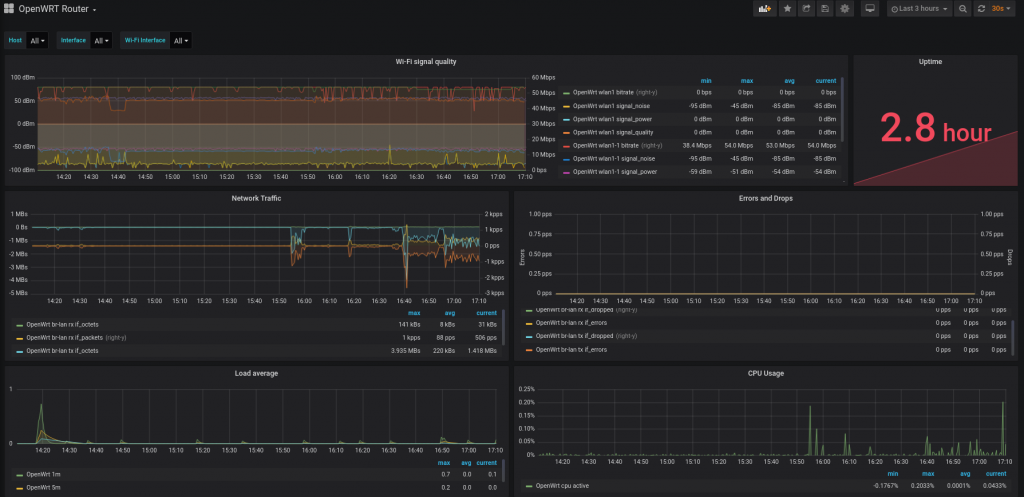
OpenWRT logging to InfluxDB & Grafana Dash

Building on the work of others before me, below you will find a complete tutorial to get OpenWRT logging to InfluxDB using the “connectd” plugin. All required code available on my GitHub.

SSH into your router console: ssh root@xxx.xxx.xxx.xxx and run the below:

opkg update
opkg install luci-app-statistics collectd collectd-mod-cpu \
collectd-mod-interface collectd-mod-iwinfo \
collectd-mod-load collectd-mod-memory collectd-mod-network collectd-mod-uptime collectd-mod-thermal collectd-mod-openvpn collectd-mod-dns collectd-mod-wireless
/etc/init.d/luci_statistics enable
/etc/init.d/collectd enable

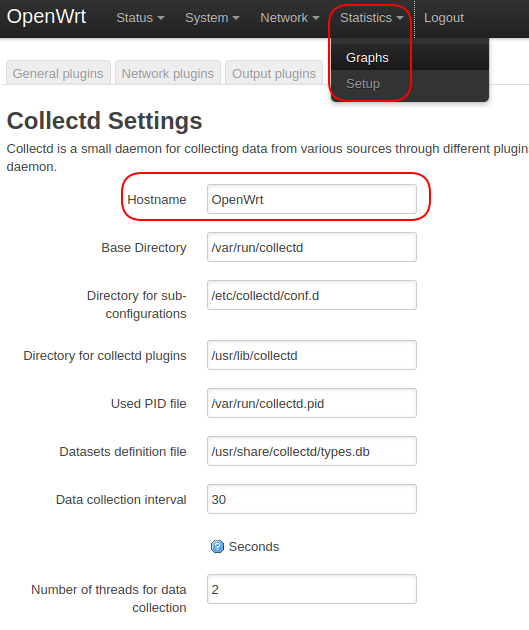
Go to router Web Interface and there is a new “Statistics” tab, its mostly setup but quick configuration: (also see screenshot below)

  • Go to Statistics -> Setup -> add ‘Hostname’ field and populate it. (doesn’t exist by default for some reason)
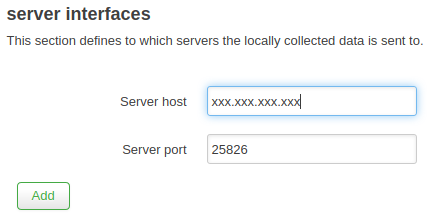
  • Go to Statistics -> Setup -> Output plugins -> add the details of your InfuxDB server. (leave the port as 25826)

We are finished with the router now, I rebooted it, not sure if was 100% necessary.

Next SSH into your InfluxDB console: ssh xxx@xxx.xxx.xxx.xxx

Create file: /usr/local/share/collectd/types.db (add file from my Github)

sudo nano /usr/local/share/collectd/types.db

We now need to enable the “collectd” plugin in InfluxDB config:

sudo nano /etc/influxdb/influxdb.conf

Configure it so it is the same as below:

[[collectd]]
   enabled = true
   bind-address = ":25826"
   database = "dev_collectd"
   retention-policy = ""
  #
  # The collectd service supports either scanning a directory for multiple types
  # db files, or specifying a single db file.
   typesdb = "/usr/local/share/collectd/types.db"
  #
   security-level = "none"
   auth-file = "/etc/collectd/auth_file"

  # These next lines control how batching works. You should have this enabled
  # otherwise you could get dropped metrics or poor performance. Batching
  # will buffer points in memory if you have many coming in.

  # Flush if this many points get buffered
   batch-size = 5000

  # Number of batches that may be pending in memory
   batch-pending = 10

  # Flush at least this often even if we haven't hit buffer limit
   batch-timeout = "10s"

  # UDP Read buffer size, 0 means OS default. UDP listener will fail if set above OS max.
   read-buffer = 0

  # Multi-value plugins can be handled two ways.
  # "split" will parse and store the multi-value plugin data into separate measurements
  # "join" will parse and store the multi-value plugin as a single multi-value measurement.
  # "split" is the default behavior for backward compatibility with previous versions of influxdb.
  # parse-multivalue-plugin = "split"

Exit & Save.

Add new database in InfluxDB, I carried this out through the Chronograf web interface but add in through the terminal by the below if required:

    influx
    create database dev_collectd
    exit

Restart InfluxDB to activate the new config:

sudo service influxd restart

Now onto Grafana Dash:

Add the “dev_collectd” database to the Grafana Data Sources list.

Next go to “Import dashboard” and paste in the JSON code on my Github. I tweaked a previous dashboard slightly.

All done!

References I used:
https://blog.christophersmart.com/2019/09/09/monitoring-openwrt-with-collectd-influxdb-and-grafana/
https://wiki.opnfv.org/display/fastpath/Installing+and+configuring+InfluxDB+and+Grafana+to+display+metrics+with+collectd

Notes on what doesn’t work:
Can’t see amount of connected wireless devices.
OpenVPN stats also not working.
Its on the to do list if I can get this going again.

InfluxDB Ver 1.x Backup Database

Note: This was implemented for InfluxDB Version 1.6. I have since upgraded to InfluxDB Version 2.x and a different method is required for this version.

It makes sense to periodically backup InfluxDB to an external drive in-case of corruption of onboard memory. I am using a USB memory stick.

A simple cronjob can take care of this (every night 2am), open Crontab:

sudo crontab -e

and insert the below line: (change for your storage device)

0 2 * * * influxd backup -portable /media/usb/drive

Backup names start with the date it was generated but it can get messy after a few weeks so long term its better to run a backup script to put backups in individual directories and catch errors etc., create a python file for this and use the below example, update crontab -e instead to:

sudo crontab -e
0 2 * * * python /home/pi/influx_scripts/influx_backup.py

Create our python backup file:

nano /home/pi/influx_scripts/influx_backup.py
import os
from datetime import date

today = date.today()

d1 = today.strftime("%Y_%m_%d")
print("Date", d1)

command = "mkdir /media/usb-backup/" + d1
#print(command)
os.system(command)

command = "influxd backup -portable /media/usb-backup/" + d1
os.system(command)

command = "kapacitor backup /media/usb-backup/"+d1+"/kapacitor.db"
os.system(command)

command = "sudo find /media/usb-backup/* -mtime +7 -type d -exec rm -rf {} \;"
os.system(command)

os.system("echo Backups Done!")

You can keep an eye on the USB memory stick size by the below snip of script which can be logged to InfluxDB. An Influx alert keeps an eye on the size and alerts if getting close to capacity.

The above already deletes all files over 7 Days old.

DIRECTORY="/media/usb/drive"
if [ -d "$DIRECTORY" ]; then
    usb_mem_usage=$(du -s $DIRECTORY | awk 'NR==1{print $1}')
else
    usb_mem_usage="-1"
fi
echo $usb_mem_usage

All done!

Resources I used:
– https://stackoverflow.com/questions/31389483/find-and-delete-file-or-folder-older-than-x-days