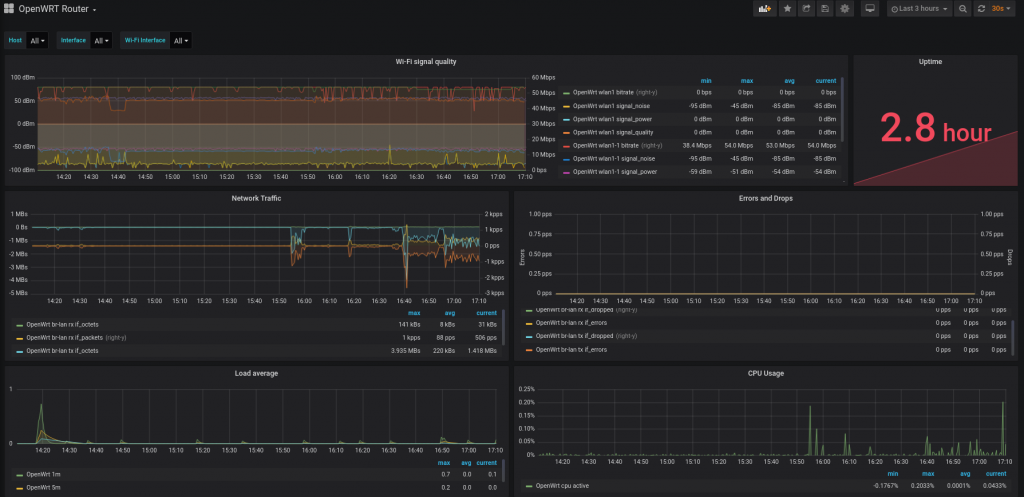
Building on the work of others before me, below you will find a complete tutorial to get OpenWRT logging to InfluxDB using the “connectd” plugin. All required code available on my GitHub.
SSH into your router console: ssh root@xxx.xxx.xxx.xxx and run the below:
opkg update
opkg install luci-app-statistics collectd collectd-mod-cpu \
collectd-mod-interface collectd-mod-iwinfo \
collectd-mod-load collectd-mod-memory collectd-mod-network collectd-mod-uptime collectd-mod-thermal collectd-mod-openvpn collectd-mod-dns collectd-mod-wireless
/etc/init.d/luci_statistics enable
/etc/init.d/collectd enable
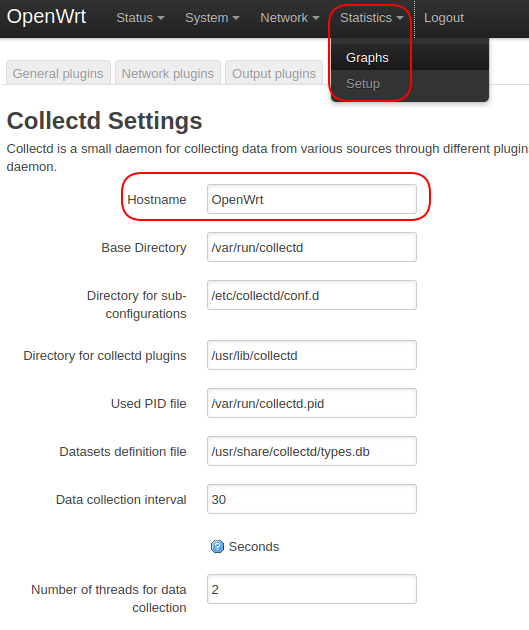
Go to router Web Interface and there is a new “Statistics” tab, its mostly setup but quick configuration: (also see screenshot below)
- Go to Statistics -> Setup -> add ‘Hostname’ field and populate it. (doesn’t exist by default for some reason)

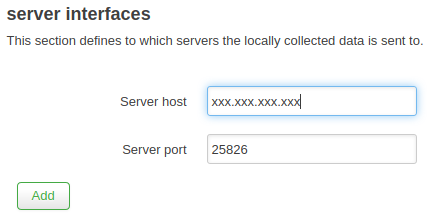
- Go to Statistics -> Setup -> Output plugins -> add the details of your InfuxDB server. (leave the port as 25826)

We are finished with the router now, I rebooted it, not sure if was 100% necessary.
Next SSH into your InfluxDB console: ssh xxx@xxx.xxx.xxx.xxx
Create file: /usr/local/share/collectd/types.db (add file from my Github)
sudo nano /usr/local/share/collectd/types.db
We now need to enable the “collectd” plugin in InfluxDB config:
sudo nano /etc/influxdb/influxdb.conf
Configure it so it is the same as below:
[[collectd]]
   enabled = true
   bind-address = ":25826"
   database = "dev_collectd"
   retention-policy = ""
  #
  # The collectd service supports either scanning a directory for multiple types
  # db files, or specifying a single db file.
   typesdb = "/usr/local/share/collectd/types.db"
  #
   security-level = "none"
   auth-file = "/etc/collectd/auth_file"

  # These next lines control how batching works. You should have this enabled
  # otherwise you could get dropped metrics or poor performance. Batching
  # will buffer points in memory if you have many coming in.

  # Flush if this many points get buffered
   batch-size = 5000

  # Number of batches that may be pending in memory
   batch-pending = 10

  # Flush at least this often even if we haven't hit buffer limit
   batch-timeout = "10s"

  # UDP Read buffer size, 0 means OS default. UDP listener will fail if set above OS max.
   read-buffer = 0

  # Multi-value plugins can be handled two ways.
  # "split" will parse and store the multi-value plugin data into separate measurements
  # "join" will parse and store the multi-value plugin as a single multi-value measurement.
  # "split" is the default behavior for backward compatibility with previous versions of influxdb.
  # parse-multivalue-plugin = "split"
Exit & Save.
Add new database in InfluxDB, I carried this out through the Chronograf web interface but add in through the terminal by the below if required:
    influx
    create database dev_collectd
    exit
Restart InfluxDB to activate the new config:
sudo service influxd restart
Now onto Grafana Dash:
Add the “dev_collectd” database to the Grafana Data Sources list.
Next go to “Import dashboard” and paste in the JSON code on my Github. I tweaked a previous dashboard slightly.
All done!
References I used:
https://blog.christophersmart.com/2019/09/09/monitoring-openwrt-with-collectd-influxdb-and-grafana/
https://wiki.opnfv.org/display/fastpath/Installing+and+configuring+InfluxDB+and+Grafana+to+display+metrics+with+collectd
Notes on what doesn’t work:
Can’t see amount of connected wireless devices.
OpenVPN stats also not working.
Its on the to do list if I can get this going again.