Logging dump1090-fa to local database

As per my previous post I am feeding ADSB Exchange and Flight Radar24 from a RaspberryPi Zero and a USB DVB-T tuner.

This post is broken into two un-linked sections:
Section 1: Logging all flights to .csv file.

Section 2 (a): Deciding there was more flexibility with logging to database SQLite (incl. setup).
Section 2 (b): Solution to show all days flights on webpage with the insane logic of DB -> .csv -> webpage. Not pretty but it works.

Logging to .csv file:

I wanted to locally log flights that flew overhead each day but didn’t have the knowledge to put it all together until /u/gl0ckner/ on Reddit posted his work on logging flights to a .csv file. That didn’t work right out of the box for me so I made some tweaks and my slight modified version can be found on my GitHub. Simply download the file and run it manually by:

python3 /home/pi/flightlogger/flight_logger_csv.py

Or make executable and add to crontab to execute every minute as so:

chmod +x /home/pi/flightlogger/flight_logger_csv.py
crontab -e
* * * * * /usr/bin/python3 /home/pi/flightlogger/flight_logger_csv.py

A new .csv is created for each day. It works well. After a few days I thought it would be more helpful to query the data if it was in a database.

Note: So now a new entry is made to the database every minute regardless if the particular aircraft has been logged previously or not on the same day. I want to change it to say only log an aircraft if not logged in the last hour, this has been implemented in the below database option.

Logging to database: (SQLite)

After a comment by /u/Uncle_BBQ on the same Reddit post who submitted his work on this I thought I would give it a go. This script logs each overhead flight once into the database. It was my first time ever using a database and as usual it didn’t work right out of the box for me so I had to make a few tweaks, below is how to get it running:

#First install dependencies.
#They did not install properly for me from the script so did it manually.
sudo apt-get update
sudo apt-get upgrade
sudo apt-get install sqlite3
pip3 install pandas
pip3 install numpy
pip3 install cython
pip3 install sqlalchemy
pip3 install psycopg2

Now we need to set up the database:

sqlite3 flightdata_1h.db
CREATE TABLE flightdata (date_time NUMERIC, date NUMERIC, time NUMERIC, hex TEXT, flight TEXT, alt_baro NUMERIC, alt_geom NUMERIC, gs NUMERIC, track NUMERIC, geom_rate NUMERIC, squawk NUMERIC, emergency TEXT, category TEXT, nav_qnh NUMERIC, nav_altitude_mcp NUMERIC, lat NUMERIC, lon NUMERIC);
.quit

Finally copy the file from my GitHub and run:

python3 /home/pi/flightlogger/flight_logger_sql.py

To see what’s in the database we can query it by:

sqlite3 flightdata_1h.db
SELECT date, time, hex, flight FROM flight_data;

Your output will look like this:

2020-03-21|20:56:23|406c39|VIR25B
2020-03-21|20:58:20|4077be|JCO7X

Finally to run the script every minute, make it executable and add to crontab:

chmod +x /home/pi/flightlogger/flight_logger_sql.py
crontab -e
* * * * * /usr/bin/python3 /home/pi/flightlogger/flight_logger_sql.py

You can query the database directly if needed, for example:

sqlite3 flightdata_1h.db
SELECT date_time, date, time, hex FROM flight_data ORDER BY DATE(DATE) desc LIMIT 100;

Updating webpage with flights that went overhead today.

Note: The perfect solution is when a webpage is requested the database is queried and the results delivered. Since I’m running SQLite and all tutorials were for SQL (and MariaDB wouldn’t run on RPi Zero) I went about it a different way. Through a cron job every hour the database is queried and the results pushed to a .csv file, this csv file is then put into a table and the webpage delivered whenever requested.

First create blank .csv file in /var/www/html/ and call it data.csv

To populate the .csv file I use:

#!/usr/bin/python3

# Import dependcies (probably don't need half of them, I just used an old file)
import os
import json
import csv
from dotenv import load_dotenv
from datetime import datetime
from datetime import date
from datetime import time
from datetime import timedelta
import requests
import pandas as pd
import numpy as np
import sqlalchemy
from sqlalchemy import create_engine

# Load env variables
load_dotenv(dotenv_path='')
db = 'sqlite:////home/pi/flightlogger/flightdata_1h.db'
db_table = 'flight_data'

# connect to database
engine = create_engine('sqlite:////home/pi/flightlogger/flightdata_1h.db')

# Get today's date
today = date.today()

# Get the current time
time = datetime.now().strftime("%H:%M:%S")

# Create a current time stamp
dateTime = datetime.strptime(datetime.now().strftime('%Y-%m-%d %H:%M:%S'), '%Y-%m-%d %H:%M:%S')

# Try to connect to database
try:
    df2 = pd.read_sql("SELECT * FROM flight_data WHERE flight_data.date_time > datetime('now','localtime', '-3600 seconds')", engine) #SQLite Syntax
    dbConnected = True

except:
    # If database does not exist or is unable to connect then print that
    print('Unable to connect to database.')
    # Set boolen value to False
    dbConnected = False

df2.to_csv("/var/www/html/data.csv", mode='a', header=False)

To clear the .csv file every night at midnight I use:

file = open("/var/www/html/data.csv","w")
file.write("index,date_time,hex,flight,alt_baro,alt_geom,gs,track,geom_rate,squawk,emergency,category,nav_qnh,nav_altitude_mcp,lat,lon,date,time\n")
file.close()

Cron jobs to run the above:

0 * * * * /usr/bin/python3 /home/pi/flightlogger/db_flight_to_csv.py
10 0 * * * /usr/bin/python /home/pi/flightlogger/csv_clear.py

The webpage located at /var/www/html/index.html is:

<!DOCTYPE html>
<html lang="en">
<!-- http://bl.ocks.org/ndarville/7075823 -->

    <head>
        <meta charset="utf-8">
        <style>
            table {
                border-collapse: collapse;
                border: 2px black solid;
                font: 12px sans-serif;
            }

            td {
                border: 1px black solid;
                padding: 5px;
            }
        </style>
    </head>
    <body>
        <!-- script src="http://d3js.org/d3.v3.min.js"></script -->
        <!-- script src="d3.min.js?v=3.2.8"></script -->
        <script src="d3.v3.min.js"></script>

        <script type="text/javascript"charset="utf-8">
            d3.text("data.csv", function(data) {
                var parsedCSV = d3.csv.parseRows(data);

                var container = d3.select("body")
                    .append("table")

                    .selectAll("tr")
                        .data(parsedCSV).enter()
                        .append("tr")

                    .selectAll("td")
                        .data(function(d) { return d; }).enter()
                        .append("td")
                        .text(function(d) { return d; });
            });
        </script>
    </body>
</html>

Give ‘pi’ user access to edit the .csv file:

sudo chown -R pi /var/www/html/data.csv 

You can view your webpage by entering the IP address of your device in a web browser.

That’s it!

Other references I used:
https://www.hackster.io/mjrobot/from-data-to-graph-a-web-journey-with-flask-and-sqlite-4dba35
https://towardsdatascience.com/sqlalchemy-python-tutorial-79a577141a91
https://docs.sqlalchemy.org/en/13/core/engines.html#postgresql
https://www.sqlitetutorial.net/sqlite-commands/

Overwrite InfluxDB point

I had an issue where I had spurious high values reported to one of my databases and I didn’t have time to debug for a while so I ended up overwriting the point about once a week. I couldn’t find a way to delete the measurement completely but overwriting works well:

Launch Influx CLI:

 influx

Select your database:

 use dev_db

Find the point you want, for me it was always the max value:

SELECT max("Energy_Usage") FROM "esp" WHERE ("Device" = 'esp_03') 

The result returned was:

name: esp
time                max
----                ---
1583863516000000000 1049397312

Now we take the time returned from above and rewrite over the point in the database, (I overwrote it with a value of 150:

INSERT esp,Device=esp_03 Energy_Usage=150 1583863516000000000

That’s it!

PiHole logging to InfluxDB & Grafana Dash

Building on the work of others before me, below you will find a tutorial to get PiHole logging to InfluxDB using a python script and then to a Grafana Dashboard. All required code available on my GitHub.

SSH into your PiHole: ssh pi@xxx.xxx.xxx.xxx and run the below:

Install python dependencies:

sudo apt-get install python-influxdb

Create the below python file:

sudo nano influx_scripts/piholestats.py
#! /usr/bin/python

# History:
# 2016: Script originally created by JON HAYWARD: https://fattylewis.com/Graphing-pi-hole-stats/
# 2016 (December) Adapted to work with InfluxDB by /u/tollsjo
# 2016 (December) Updated by Cludch https://github.com/sco01/piholestatus
# 2020 (March) Updated by http://cactusprojects.com/pihole-logging-to-influxdb-&-grafana-dash

import requests
import time
from influxdb import InfluxDBClient

HOSTNAME = "pihole" # Pi-hole hostname to report in InfluxDB for each measurement
PIHOLE_API = "http://192.168.1.XXX/admin/api.php"
INFLUXDB_SERVER = "192.168.1.XXX" # IP or hostname to InfluxDB server
INFLUXDB_PORT = 8086 # Port on InfluxDB server
INFLUXDB_USERNAME = ""
INFLUXDB_PASSWORD = ""
INFLUXDB_DATABASE = "dev_pihole"
DELAY = 10 # seconds

def send_msg(domains_blocked, dns_queries_today, ads_percentage_today, ads_blocked_today):

	json_body = [
	    {
	        "measurement": "piholestats." + HOSTNAME.replace(".", "_"),
	        "tags": {
	            "host": HOSTNAME
	        },
	        "fields": {
	            "domains_blocked": int(domains_blocked),
                    "dns_queries_today": int(dns_queries_today),
                    "ads_percentage_today": float(ads_percentage_today),
                    "ads_blocked_today": int(ads_blocked_today)
	        }
	    }
	]

	client = InfluxDBClient(INFLUXDB_SERVER, INFLUXDB_PORT, INFLUXDB_USERNAME, INFLUXDB_PASSWORD, INFLUXDB_DATABASE) # InfluxDB host, InfluxDB port, Username, Password, database
	# client.create_database(INFLUXDB_DATABASE) # Uncomment to create the database (expected to exist prior to feeding it data)
	client.write_points(json_body)

api = requests.get(PIHOLE_API) # URI to pihole server api
API_out = api.json()

#print (API_out) # Print out full data, there are other parameters not sent to InfluxDB

domains_blocked = (API_out['domains_being_blocked'])#.replace(',', '')
dns_queries_today = (API_out['dns_queries_today'])#.replace(',', '')
ads_percentage_today = (API_out['ads_percentage_today'])#
ads_blocked_today = (API_out['ads_blocked_today'])#.replace(',', '')

send_msg(domains_blocked, dns_queries_today, ads_percentage_today, ads_blocked_today)

Save and Exit.

I have the file run on a cron job every minute. Others set it up as a service but cron job works just fine for me:

crontab -e
*/1 * * * * /usr/bin/python /home/pi/influx_scripts/piholestats.py

We need to create Influx database next, I carried this out through the Chronograf web interface but add it through the terminal by the below if required:

influx
create database dev_pihole
exit

Now onto Grafana Dash:

Add the “dev_pihole” database to the Grafana Data Sources list.

Next go to “Import dashboard” and paste in the JSON code on my Github. I tweaked a previous dashboard slightly.

All done!

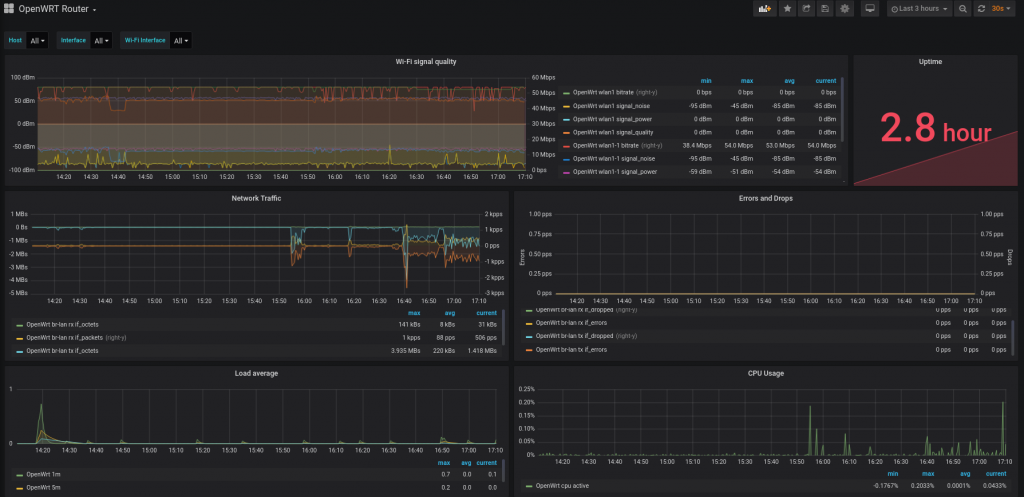
OpenWRT logging to InfluxDB & Grafana Dash

Building on the work of others before me, below you will find a complete tutorial to get OpenWRT logging to InfluxDB using the “connectd” plugin. All required code available on my GitHub.

SSH into your router console: ssh root@xxx.xxx.xxx.xxx and run the below:

opkg update
opkg install luci-app-statistics collectd collectd-mod-cpu \
collectd-mod-interface collectd-mod-iwinfo \
collectd-mod-load collectd-mod-memory collectd-mod-network collectd-mod-uptime collectd-mod-thermal collectd-mod-openvpn collectd-mod-dns collectd-mod-wireless
/etc/init.d/luci_statistics enable
/etc/init.d/collectd enable

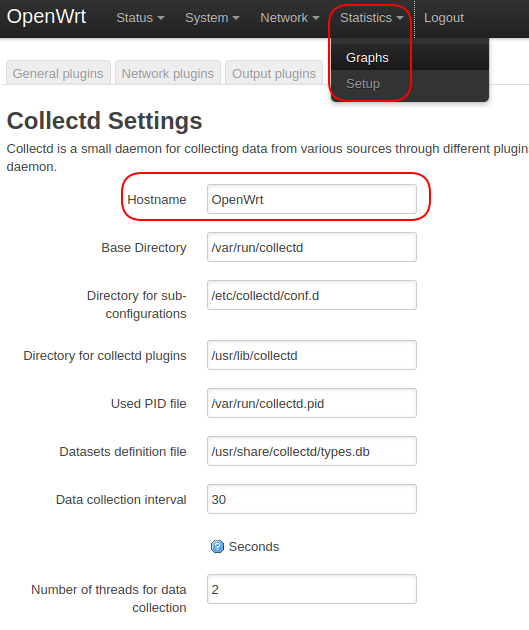
Go to router Web Interface and there is a new “Statistics” tab, its mostly setup but quick configuration: (also see screenshot below)

  • Go to Statistics -> Setup -> add ‘Hostname’ field and populate it. (doesn’t exist by default for some reason)
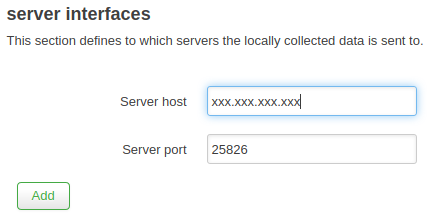
  • Go to Statistics -> Setup -> Output plugins -> add the details of your InfuxDB server. (leave the port as 25826)

We are finished with the router now, I rebooted it, not sure if was 100% necessary.

Next SSH into your InfluxDB console: ssh xxx@xxx.xxx.xxx.xxx

Create file: /usr/local/share/collectd/types.db (add file from my Github)

sudo nano /usr/local/share/collectd/types.db

We now need to enable the “collectd” plugin in InfluxDB config:

sudo nano /etc/influxdb/influxdb.conf

Configure it so it is the same as below:

[[collectd]]
   enabled = true
   bind-address = ":25826"
   database = "dev_collectd"
   retention-policy = ""
  #
  # The collectd service supports either scanning a directory for multiple types
  # db files, or specifying a single db file.
   typesdb = "/usr/local/share/collectd/types.db"
  #
   security-level = "none"
   auth-file = "/etc/collectd/auth_file"

  # These next lines control how batching works. You should have this enabled
  # otherwise you could get dropped metrics or poor performance. Batching
  # will buffer points in memory if you have many coming in.

  # Flush if this many points get buffered
   batch-size = 5000

  # Number of batches that may be pending in memory
   batch-pending = 10

  # Flush at least this often even if we haven't hit buffer limit
   batch-timeout = "10s"

  # UDP Read buffer size, 0 means OS default. UDP listener will fail if set above OS max.
   read-buffer = 0

  # Multi-value plugins can be handled two ways.
  # "split" will parse and store the multi-value plugin data into separate measurements
  # "join" will parse and store the multi-value plugin as a single multi-value measurement.
  # "split" is the default behavior for backward compatibility with previous versions of influxdb.
  # parse-multivalue-plugin = "split"

Exit & Save.

Add new database in InfluxDB, I carried this out through the Chronograf web interface but add in through the terminal by the below if required:

    influx
    create database dev_collectd
    exit

Restart InfluxDB to activate the new config:

sudo service influxd restart

Now onto Grafana Dash:

Add the “dev_collectd” database to the Grafana Data Sources list.

Next go to “Import dashboard” and paste in the JSON code on my Github. I tweaked a previous dashboard slightly.

All done!

References I used:
https://blog.christophersmart.com/2019/09/09/monitoring-openwrt-with-collectd-influxdb-and-grafana/
https://wiki.opnfv.org/display/fastpath/Installing+and+configuring+InfluxDB+and+Grafana+to+display+metrics+with+collectd

Notes on what doesn’t work:
Can’t see amount of connected wireless devices.
OpenVPN stats also not working.
Its on the to do list if I can get this going again.

ESP8266 Deep Sleep Energy Saving

After reading many post of people getting months of ESP8266 running time off batteries I decided to set up my own to see why my battery life was terrible:

Parts:
Node MCU ESP8266 (CH349G Serial Chip, AMS1117 Voltage Regulator)
LiPo Battery: 2S 850mAh (7.4V)
ADS1115 ADC (to measure voltage, 500K Voltage divider)

Test setup:
Two ESP8266 setups were completed, one ESP was standard and the other had the LED and Serial Chip disconnected to conserve Battery.

Test Program:
ESP Wake every 20 seconds (with radio disabled)
Take voltage reading and store in RTC memory
Deep Sleep
……………………………………………………………..
Every 5 minutes (15 wake cycles)
Take voltage reading
Connect to network and transmit all data to Influx Database.
Disconnect from network
Deep Sleep

Results:
You can see from the below screenshot the battery voltage over the duration of the test:

Unmodified ESP8266:
Time from 8.36V to 7.28V (97% to 7% of Li-Po capacity) was 87hrs and 20mins (3.6 Days)

Modified ESP8266: (No LED or Serial Chip)
Time from 8.36V to 7.28V (97% to 7% of Li-Po capacity) was 101hrs and 16mins (4.2 Days)

Conclusion:
Months of usage seem far from achievable with a minimal setup and all precautions taken. Actually the ESP seems pretty unusable on a battery for anything more than a measurement every few hours.

Further Improvements:
The stock voltage regulator is a known power drain, an alternative is recommended but I did not get around to that yet.

That’s it!

InfluxDB Ver 1.x Backup Database

Note: This was implemented for InfluxDB Version 1.6. I have since upgraded to InfluxDB Version 2.x and a different method is required for this version.

It makes sense to periodically backup InfluxDB to an external drive in-case of corruption of onboard memory. I am using a USB memory stick.

A simple cronjob can take care of this (every night 2am), open Crontab:

sudo crontab -e

and insert the below line: (change for your storage device)

0 2 * * * influxd backup -portable /media/usb/drive

Backup names start with the date it was generated but it can get messy after a few weeks so long term its better to run a backup script to put backups in individual directories and catch errors etc., create a python file for this and use the below example, update crontab -e instead to:

sudo crontab -e
0 2 * * * python /home/pi/influx_scripts/influx_backup.py

Create our python backup file:

nano /home/pi/influx_scripts/influx_backup.py
import os
from datetime import date

today = date.today()

d1 = today.strftime("%Y_%m_%d")
print("Date", d1)

command = "mkdir /media/usb-backup/" + d1
#print(command)
os.system(command)

command = "influxd backup -portable /media/usb-backup/" + d1
os.system(command)

command = "kapacitor backup /media/usb-backup/"+d1+"/kapacitor.db"
os.system(command)

command = "sudo find /media/usb-backup/* -mtime +7 -type d -exec rm -rf {} \;"
os.system(command)

os.system("echo Backups Done!")

You can keep an eye on the USB memory stick size by the below snip of script which can be logged to InfluxDB. An Influx alert keeps an eye on the size and alerts if getting close to capacity.

The above already deletes all files over 7 Days old.

DIRECTORY="/media/usb/drive"
if [ -d "$DIRECTORY" ]; then
    usb_mem_usage=$(du -s $DIRECTORY | awk 'NR==1{print $1}')
else
    usb_mem_usage="-1"
fi
echo $usb_mem_usage

All done!

Resources I used:
– https://stackoverflow.com/questions/31389483/find-and-delete-file-or-folder-older-than-x-days

Setup HTTPS for Grafana

By default Grafana operates over HTTP but for added security you can operate over HTTPS. For my use case I am using a self generated certificate as not using a public domain.

Generate Keys: (a key.pem and cert.pm files will be generated)

openssl req -newkey rsa:2048 -new -nodes -x509 -days 3650 -keyout key.pem -out cert.pem

Put the keys in /home/pi/ directory. It did not work for me in the /etc/grafana/ directory.

sudo mv cert.pem /home/pi/
sudo mv key.pem /home/pi/

Change permissions of the keys:

sudo chmod -R 777 /home/pi/cert.pem
sudo chmod -R 777 /home/pi/key.pem 

Edit Grafana Config File:

sudo nano /etc/grafana/grafana.ini

Ensure the server protocol is updated and the key locations listed:

[server]
# Protocol (http, https, socket)
protocol = https

# https certs & key file
cert_file = /home/pi/cert.pem
cert_key = /home/pi/key.pem

Reboot system and all done!

Capacitive Touch Hack (for Fluval Edge Aquarium Control)

This post is about automating the light on the Fluval Edge Aquarium but can be applied to any capacitive touch button I imagine. It turns the light on at 10am in the morning, turns it blue at 8pm and finally turns it off at midnight. It has real time clock (RTC) to keep track of time and can recover from power outages due to storing current state in EEPROM.

My first attempt was to have passive control by creating capacitance on a piece of aluminium foil/tape and manipulating this to activate the sensor but I could not get it working so the not so elegant solution is to have a servo ‘touch’ the sensor on a schedule.

Video of it in action:

Parts Required:
Arduino (any), I used Nano.
RTC (any), I used DS1307.
Servo (any), I used HK15178 10g servo.

Connections: (aside from power which are all 5V)
Arduino A4 -> RTC SDA
Arduino A5 -> RTC SCL
Arduino D3 -> Servo Control (was yellow wire for me)

Paste of Arduino code below, don’t forget to add the RTC library, hosted here if you don’t have it already.

#include <Wire.h>
#include "RTClib.h"
#include <EEPROM.h>
#include <Servo.h>

Servo myservo;  // create servo object to control a servo 

RTC_DS1307 RTC;

char receivedChar;
boolean newData = false;
int pos_standby = 180;    // variable to store the servo position 
int pos_active = 100;
int led = 13;
int mode = 1;             //1 for PROD, 2 for DEV (Serial Input
int bulb_status = 0;
int starttime = 0;
int endtime = 0;
int loopcount = 0;
int address = 12;
byte value;

void setup() { 
  Serial.begin(9600);
  Wire.begin();
  RTC.begin();
  if (! RTC.isrunning()) {
    Serial.println("RTC is NOT running!");
  }
  
  read_eeprom();              // Gets current position from EEPROM
  myservo.attach(3);          // Attaches the servo on pin 3 to the servo object 
  myservo.write(pos_standby); // Puts servo in default position
  Serial.println("Setup Complete");

  //#### Uncomment the below to set the RTC to the date & time this sketch was compiled ###
  //#### Then comment it out again and reupload sketch to Arduino ###  
  //RTC.adjust(DateTime(__DATE__, __TIME__));
}

void loop() {
  print_time();
  delay(500); 
  while (true){
   
      if (mode == 1) {
        bulb_sequence();
        }      
  
      starttime = millis();
      endtime = starttime;
      while (((endtime - starttime) <=10000) || (loopcount < 10000)) // do this loop for up to 10000mS
        {
        loopcount = loopcount+1;
        endtime = millis();
        }  
        
   recvOneChar();
   showNewData();

    if (receivedChar=='a') {
    Serial.println("A Selected");
    servo_move(1); //Bulb ON
    }  
    else if (receivedChar=='b') {
    Serial.println("B Selected");
    servo_move(2); //Bulb BLUE
    }     
    else if (receivedChar=='c') {
    Serial.println("C Selected");
    servo_move(3); //Bulb OFF
    }    
   receivedChar='d';
        
  }
}

void recvOneChar() {
 if (Serial.available() > 0) {
 receivedChar = Serial.read();
 newData = true;
 }
}

void showNewData() {
 if (newData == true) {
 //Serial.print("This just in ... ");
 //Serial.println(receivedChar);
 newData = false;
 }
}

void bulb_sequence() {
      DateTime now = RTC.now();
      if (now.hour() > 10 && now.hour() < 20 && bulb_status!=1) {
          servo_move(1); //Bulb ON
          }
      else if (now.hour() > 19 && now.hour() < 23 && bulb_status!=2) {
          servo_move(2); //Bulb BLUE
          }
      else if (now.hour()>=23 && bulb_status!=3) {
          servo_move(3); //Bulb OFF
          }   
          //Serial.println(bulb_status); 
          //Serial.println(now.hour);     
}

void servo_move(int x) 
{ 
  read_eeprom();
  while (bulb_status != x) {
    servo(); 
  }
  write_eeprom();   
} 

void servo() 
{ 
  myservo.write(pos_active);              // tell servo to go to position in variable 'pos' 
  delay(1000);                     // waits 1s for the servo to reach the position                       
  myservo.write(pos_standby);              // tell servo to go to position in variable 'pos' 
  delay(1000);                     // waits 1s for the servo to reach the position  
  bulb_status += 1;
  if (bulb_status == 4) {
    bulb_status = 1;
    digitalWrite(led, HIGH);  
    }
  digitalWrite(led, LOW);  
} 

void print_time() {
    DateTime now = RTC.now(); 
    Serial.print(now.year(), DEC);
    Serial.print('/');
    Serial.print(now.month(), DEC);
    Serial.print('/');
    Serial.print(now.day(), DEC);
    Serial.print(' ');
    Serial.print(now.hour(), DEC);
    Serial.print(':');
    Serial.print(now.minute(), DEC);
    Serial.print(':');
    Serial.print(now.second(), DEC);
    Serial.println();
}

void read_eeprom()
{
  // read a byte from the current address of the EEPROM
  value = EEPROM.read(address);
  Serial.print("EERPROM Stored Value at Address: "); 
  Serial.print(address);
  Serial.print("\t");
  Serial.print(value, DEC);
  Serial.println();
  bulb_status = value;
}

void write_eeprom()
{
  EEPROM.write(address, bulb_status);
  Serial.print("New EEPROM: ");
  Serial.println(bulb_status);
}

That’s it!

Using Python to get IP Address updates via Email

For those with Internet providers that change external IP regularly, this is a simple Python script to email you when a change occurs.

Get started by logging into your Linux Box / Raspberry Pi and install dependencies:

sudo apt-get install python-setuptools (or sudo apt-get install python3-setuptools if using python 3)
cd /home/pi
mkdir ip_check
cd ip_check
wget https://github.com/psf/requests/archive/master.zip
unzip requests-main.zip
cd requests-main/
python setup.py install

Copy the ip-check.py file (or copy below) into the /home/pi/ip_check directory: (Change the SMTP SETTINGS for your email address)

#!/usr/bin/env python

#This script establishes the public IP Address.
#It compares the IP to the stored IP address,
#if they differ the new IP is archived and an 
#email sent with the new IP address.

import sys
import csv
import time
import os
from smtplib import SMTP_SSL as SMTP    #This invokes the secure SMTP protocol (port 465, uses SSL)
from email.MIMEText import MIMEText     #For email
from requests import get		#Only additional package required

### Debug ###
debug = 0		#Give verbose output
force_email = 0		#Forces write to file & Email even if IP address not changed

### SMTP SETTINGS ###
SMTPserver = 'YOUR_SMTP SERVER'
sender =     'YOUR_EMAIL_ADDRESS_TO_SEND_FROM'
USERNAME = "YOUR_EMAIL_ADDRESS_TO_SEND_FROM"
PASSWORD = "YOUR_EMAIL_PASSWORD"
destination = ['EMAIL_ADDRESS_TO_SEND_UPDATES_TO']

### Program Variables ###
text_subtype = 'plain'
content=""
subject="New IP Address"
file_location = '/home/pi/ip_check/ip.csv'
archived_ip = "0.0.0.0"
current_ip = "0.0.0.0"

# Initialise the system and start the main loop
def main():
	check_file_exists() 	#Ensures we have a file to write to.
	get_archived_ip()	#Gets the last recorded IP Address	
	get_current_ip()	#Gets the current IP Address
	compare_ip()

def check_file_exists():
	if not os.path.isfile(file_location):
		try:
			print "File doesn't exist so creating it"
        		with open(file_location, 'a') as csvfile:
            			logfile = csv.writer(csvfile, delimiter=',')
            			logfile.writerow(["Date", "Time", "Public IP"])
			get_current_ip()
			update_ip_file()
			send_email()
			print "File Created, Updated and Email Sent"

		except:
			print "Issue writing to file"
        		pass      		 		

def get_archived_ip():
	global archived_ip
	with open(file_location, 'rb') as csvfile:
		logfile = csv.reader(csvfile, delimiter=',')
		for row in logfile:
			archived_ip = row[2]
		
		if debug == 1:
			print 'My archived public IP address is:', archived_ip

def get_current_ip():
	global current_ip
	current_ip = get('http://api.ipify.org').text

	if debug == 1:
		print 'My public IP address is:', current_ip

def compare_ip():
	if str(archived_ip) != str(current_ip) and (len(current_ip) < 100 ):
		if debug == 1:
			print "IP Address has changed"		
		update_ip_file()
		send_email()
	else:
		if debug == 1:
			print "IP Address has not changed"	

def update_ip_file():
	try:
        	with open(file_location, 'a') as csvfile:
            		logfile = csv.writer(csvfile, delimiter=',')
			logfile.writerow([(time.strftime("%d/%m/%Y")), (time.strftime("%H:%M:%S")), current_ip])
    	except:    
    		pass 

def send_email():
	print "About to send email"
        try:
		content = "Current IP: " + str(current_ip)
		msg = MIMEText(content, text_subtype)
                msg['Subject'] = "New IP address!"
                msg['From'] = sender #some SMTP servers will do this automatically, not all.
		
		if debug == 1:
			print msg.as_string()

                conn = SMTP(SMTPserver)
                conn.set_debuglevel(False)
                conn.login(USERNAME, PASSWORD)

                try:
                        conn.sendmail(sender, destination, msg.as_string())
                finally:
                        print "Email Sent"                      
                        conn.close()
        except Exception, exc:
                sys.exit( "mail failed; %s" % str(exc) ) #give a error message

if __name__ == "__main__":
    main()

Okay we are now going to run it for the first time:

cd /home/pi/ip_check
python ip-check.py

All should work, not lets make it run every 15minutes automatically by cron:

crontab -e

and add the below to the file:

*/15 * * * * /usr/bin/python /home/pi/ip_check/ip-check.py

That’s it.

Simple Data Backup with rsync

I struggled for years to manage simple home data backups effectively but a nice Linux tool (rsync) exists to make it very manageable, here are some use cases I use frequently to make it a breeze:

A straight copy of one drive to another:

  • n – this will show the output without doing anything (dry run), remove this to run the backup.
  • r – this means recursive, basically it will catch all files.
  • u – this skips files that are newer on ‘drive2’, I use this to ensure files are a true copy in case of a mix-up.
  • v – makes the output verbose, gives lots of information on progress.
rsync -nruv /media/drive1/ /media/drive2

As of recent I started using the –checksum argument due to not following my own rules and doing a backup that overwrote modification time of all files, this argument looks at the file checksum (unique identifier) as opposed to the modification time to do a backup:

rsync -nruv --checksum /media/drive1/ /media/drive2

This was supposed to just get you on your feet with backups, a lot more options are available, read on here perhaps:

By modifying a tutorial on the opensource blog I was really able to streamline and speed up the backups, save the below as a shell script, it makes light work of multiple Terabytes of data:

DIRS="directory_to_copy"
SRC="/media/drive1"
DEST="/media/drive2"

for DIR in $DIRS; do
     cd "$SRC"/$DIRS
     rsync -cdlptgov --delete . /"$DEST"/$DIR
     find . -maxdepth 1 -type d -not -name "." -exec rsync -crlptgov --delete {} /"$DEST"/$DIR \;
done

Resources I used:
https://ss64.com/bash/rsync.html
https://opensource.com/article/19/5/advanced-rsync
https://www.computerhope.com/unix/rsync.htm

That’s it!