So you will have InfluxDB installed and data stored in the database, now we are going to visualize this data in Grafana. Click on the images to see the detail.

Install Grafana by:
wget https://raw.githubusercontent.com/trashware/grafana-rpi-zero/master/grafana_6.0.1_armhf.deb

sudo apt-get install adduser libfontconfig

sudo dpkg -i grafana_6.0.1_armhf.deb

sudo update-rc.d grafana-server defaults

sudo service grafana-server start
Grafana will be running now so in a browser you can navigate to the IP of your device, port 3000, for example 192.168.1.2:3000. User and Password is admin. We will create our first graphic later on but now back to the Raspberry Pi.
After a reboot check if Grafana starts up like it should. (mine didn’t)
service grafana-server status
If it does not show as “active (running)” then run the below:
sudo systemctl enable grafana-server.service
Okay now lets start creating a graphic, on a browser go to the device (for example 192.168.1.2:3000) and login, default user and password is admin.

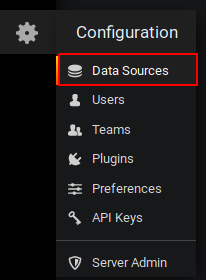
Now we need to add a database, click on the cog wheel and select Data Sources and then click “Add Data Sources”

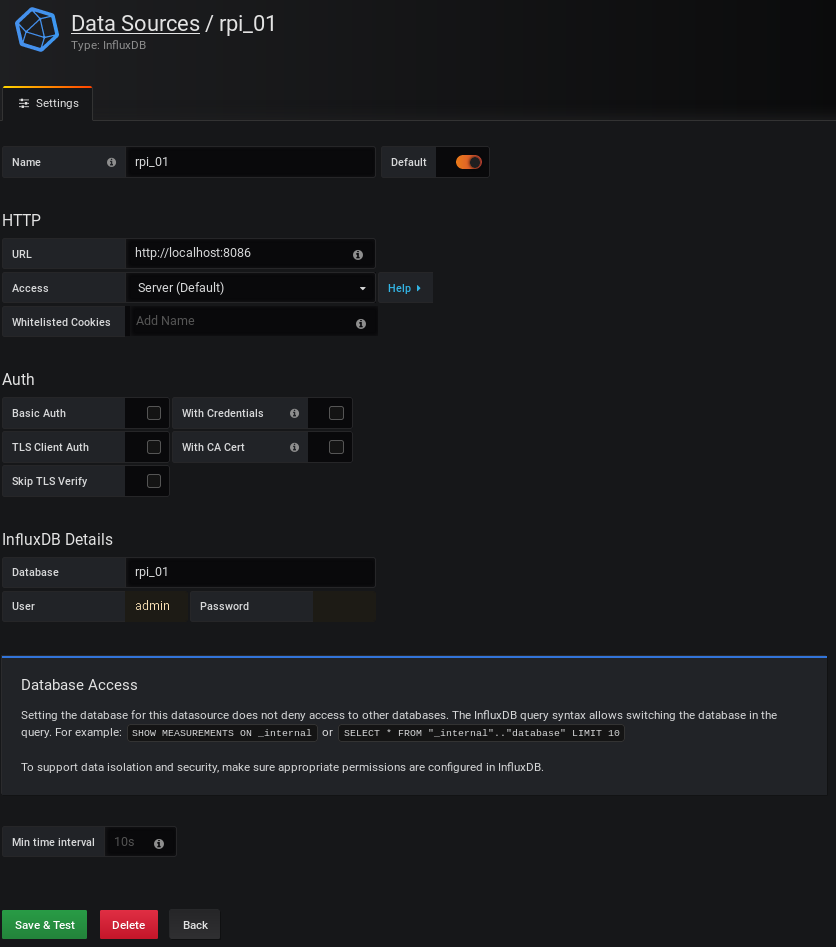
Setup your database like the below. rpi_01 is the name of the database I created in the previous tutorial. Then Click Save & Test. Everything should work.
Now lets create a graph, go to Dashboard -> Add Panel (top right area) -> Choose Visualization -> Graph. Set up the 4 setting tabs like mine below:

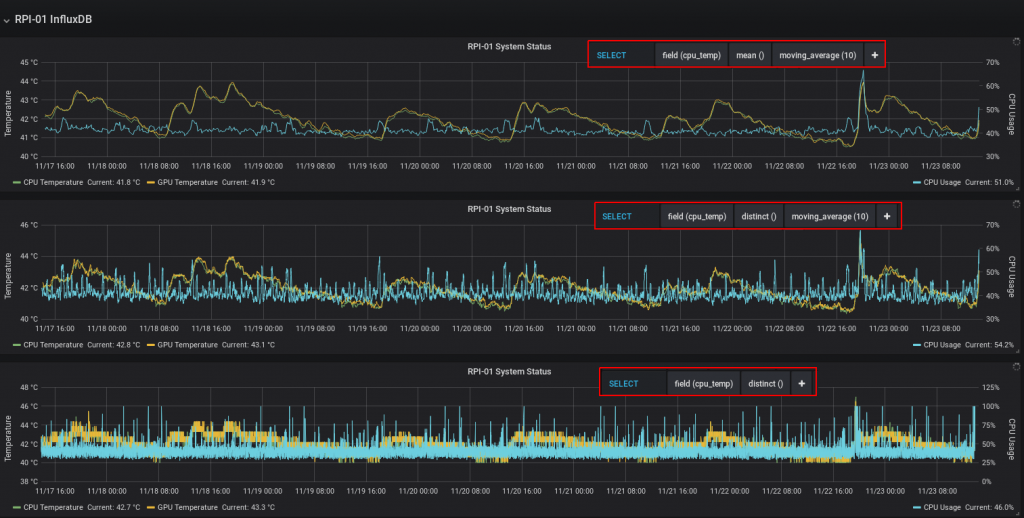
Now you will have a single graph like the top graph of mine below. Read on to understand how to efficiently show the data.

The above graphs all are showing the same data but by far the top graph is the easiest to read. This is displaying a moving average (10 samples) of the mean of the data. The middle graph is displaying moving average (10 samples) of the distinct data values. The bottom chart is just showing distinct values.
Another important setting is the Group By. Grafana only show as much data as it needs if you leave the Group By as time($_interval), otherwise it will fetch far more data than required in long time series and visualizations may fail to load.

Resources Used:
https://www.circuits.dk/install-grafana-influxdb-raspberry/
https://www.neteye-blog.com/2017/02/how-to-tune-your-grafana-dashboards/


Hi
this was a great help for me.
Thanks.
Got my first graphics running.
Martin.
Excellent good to hear!
Most Raspberry Pi + Grafana articles are for the “bigger” pi’s (armv7). This one’s for the Pi zero (armv6) and it works! Thank you very much for this great article.
Glad to hear it helped!