Logging dump1090-fa to local database

As per my previous post I am feeding ADSB Exchange and Flight Radar24 from a RaspberryPi Zero and a USB DVB-T tuner.

This post is broken into two un-linked sections:
Section 1: Logging all flights to .csv file.

Section 2 (a): Deciding there was more flexibility with logging to database SQLite (incl. setup).
Section 2 (b): Solution to show all days flights on webpage with the insane logic of DB -> .csv -> webpage. Not pretty but it works.

Logging to .csv file:

I wanted to locally log flights that flew overhead each day but didn’t have the knowledge to put it all together until /u/gl0ckner/ on Reddit posted his work on logging flights to a .csv file. That didn’t work right out of the box for me so I made some tweaks and my slight modified version can be found on my GitHub. Simply download the file and run it manually by:

python3 /home/pi/flightlogger/flight_logger_csv.py

Or make executable and add to crontab to execute every minute as so:

chmod +x /home/pi/flightlogger/flight_logger_csv.py
crontab -e
* * * * * /usr/bin/python3 /home/pi/flightlogger/flight_logger_csv.py

A new .csv is created for each day. It works well. After a few days I thought it would be more helpful to query the data if it was in a database.

Note: So now a new entry is made to the database every minute regardless if the particular aircraft has been logged previously or not on the same day. I want to change it to say only log an aircraft if not logged in the last hour, this has been implemented in the below database option.

Logging to database: (SQLite)

After a comment by /u/Uncle_BBQ on the same Reddit post who submitted his work on this I thought I would give it a go. This script logs each overhead flight once into the database. It was my first time ever using a database and as usual it didn’t work right out of the box for me so I had to make a few tweaks, below is how to get it running:

#First install dependencies.
#They did not install properly for me from the script so did it manually.
sudo apt-get update
sudo apt-get upgrade
sudo apt-get install sqlite3
pip3 install pandas
pip3 install numpy
pip3 install cython
pip3 install sqlalchemy
pip3 install psycopg2

Now we need to set up the database:

sqlite3 flightdata_1h.db
CREATE TABLE flightdata (date_time NUMERIC, date NUMERIC, time NUMERIC, hex TEXT, flight TEXT, alt_baro NUMERIC, alt_geom NUMERIC, gs NUMERIC, track NUMERIC, geom_rate NUMERIC, squawk NUMERIC, emergency TEXT, category TEXT, nav_qnh NUMERIC, nav_altitude_mcp NUMERIC, lat NUMERIC, lon NUMERIC);
.quit

Finally copy the file from my GitHub and run:

python3 /home/pi/flightlogger/flight_logger_sql.py

To see what’s in the database we can query it by:

sqlite3 flightdata_1h.db
SELECT date, time, hex, flight FROM flight_data;

Your output will look like this:

2020-03-21|20:56:23|406c39|VIR25B
2020-03-21|20:58:20|4077be|JCO7X

Finally to run the script every minute, make it executable and add to crontab:

chmod +x /home/pi/flightlogger/flight_logger_sql.py
crontab -e
* * * * * /usr/bin/python3 /home/pi/flightlogger/flight_logger_sql.py

You can query the database directly if needed, for example:

sqlite3 flightdata_1h.db
SELECT date_time, date, time, hex FROM flight_data ORDER BY DATE(DATE) desc LIMIT 100;

Updating webpage with flights that went overhead today.

Note: The perfect solution is when a webpage is requested the database is queried and the results delivered. Since I’m running SQLite and all tutorials were for SQL (and MariaDB wouldn’t run on RPi Zero) I went about it a different way. Through a cron job every hour the database is queried and the results pushed to a .csv file, this csv file is then put into a table and the webpage delivered whenever requested.

First create blank .csv file in /var/www/html/ and call it data.csv

To populate the .csv file I use:

#!/usr/bin/python3

# Import dependcies (probably don't need half of them, I just used an old file)
import os
import json
import csv
from dotenv import load_dotenv
from datetime import datetime
from datetime import date
from datetime import time
from datetime import timedelta
import requests
import pandas as pd
import numpy as np
import sqlalchemy
from sqlalchemy import create_engine

# Load env variables
load_dotenv(dotenv_path='')
db = 'sqlite:////home/pi/flightlogger/flightdata_1h.db'
db_table = 'flight_data'

# connect to database
engine = create_engine('sqlite:////home/pi/flightlogger/flightdata_1h.db')

# Get today's date
today = date.today()

# Get the current time
time = datetime.now().strftime("%H:%M:%S")

# Create a current time stamp
dateTime = datetime.strptime(datetime.now().strftime('%Y-%m-%d %H:%M:%S'), '%Y-%m-%d %H:%M:%S')

# Try to connect to database
try:
    df2 = pd.read_sql("SELECT * FROM flight_data WHERE flight_data.date_time > datetime('now','localtime', '-3600 seconds')", engine) #SQLite Syntax
    dbConnected = True

except:
    # If database does not exist or is unable to connect then print that
    print('Unable to connect to database.')
    # Set boolen value to False
    dbConnected = False

df2.to_csv("/var/www/html/data.csv", mode='a', header=False)

To clear the .csv file every night at midnight I use:

file = open("/var/www/html/data.csv","w")
file.write("index,date_time,hex,flight,alt_baro,alt_geom,gs,track,geom_rate,squawk,emergency,category,nav_qnh,nav_altitude_mcp,lat,lon,date,time\n")
file.close()

Cron jobs to run the above:

0 * * * * /usr/bin/python3 /home/pi/flightlogger/db_flight_to_csv.py
10 0 * * * /usr/bin/python /home/pi/flightlogger/csv_clear.py

The webpage located at /var/www/html/index.html is:

<!DOCTYPE html>
<html lang="en">
<!-- http://bl.ocks.org/ndarville/7075823 -->

    <head>
        <meta charset="utf-8">
        <style>
            table {
                border-collapse: collapse;
                border: 2px black solid;
                font: 12px sans-serif;
            }

            td {
                border: 1px black solid;
                padding: 5px;
            }
        </style>
    </head>
    <body>
        <!-- script src="http://d3js.org/d3.v3.min.js"></script -->
        <!-- script src="d3.min.js?v=3.2.8"></script -->
        <script src="d3.v3.min.js"></script>

        <script type="text/javascript"charset="utf-8">
            d3.text("data.csv", function(data) {
                var parsedCSV = d3.csv.parseRows(data);

                var container = d3.select("body")
                    .append("table")

                    .selectAll("tr")
                        .data(parsedCSV).enter()
                        .append("tr")

                    .selectAll("td")
                        .data(function(d) { return d; }).enter()
                        .append("td")
                        .text(function(d) { return d; });
            });
        </script>
    </body>
</html>

Give ‘pi’ user access to edit the .csv file:

sudo chown -R pi /var/www/html/data.csv 

You can view your webpage by entering the IP address of your device in a web browser.

That’s it!

Other references I used:
https://www.hackster.io/mjrobot/from-data-to-graph-a-web-journey-with-flask-and-sqlite-4dba35
https://towardsdatascience.com/sqlalchemy-python-tutorial-79a577141a91
https://docs.sqlalchemy.org/en/13/core/engines.html#postgresql
https://www.sqlitetutorial.net/sqlite-commands/

Overwrite InfluxDB point

I had an issue where I had spurious high values reported to one of my databases and I didn’t have time to debug for a while so I ended up overwriting the point about once a week. I couldn’t find a way to delete the measurement completely but overwriting works well:

Launch Influx CLI:

 influx

Select your database:

 use dev_db

Find the point you want, for me it was always the max value:

SELECT max("Energy_Usage") FROM "esp" WHERE ("Device" = 'esp_03') 

The result returned was:

name: esp
time                max
----                ---
1583863516000000000 1049397312

Now we take the time returned from above and rewrite over the point in the database, (I overwrote it with a value of 150:

INSERT esp,Device=esp_03 Energy_Usage=150 1583863516000000000

That’s it!

PiHole logging to InfluxDB & Grafana Dash

Building on the work of others before me, below you will find a tutorial to get PiHole logging to InfluxDB using a python script and then to a Grafana Dashboard. All required code available on my GitHub.

SSH into your PiHole: ssh pi@xxx.xxx.xxx.xxx and run the below:

Install python dependencies:

sudo apt-get install python-influxdb

Create the below python file:

sudo nano influx_scripts/piholestats.py
#! /usr/bin/python

# History:
# 2016: Script originally created by JON HAYWARD: https://fattylewis.com/Graphing-pi-hole-stats/
# 2016 (December) Adapted to work with InfluxDB by /u/tollsjo
# 2016 (December) Updated by Cludch https://github.com/sco01/piholestatus
# 2020 (March) Updated by http://cactusprojects.com/pihole-logging-to-influxdb-&-grafana-dash

import requests
import time
from influxdb import InfluxDBClient

HOSTNAME = "pihole" # Pi-hole hostname to report in InfluxDB for each measurement
PIHOLE_API = "http://192.168.1.XXX/admin/api.php"
INFLUXDB_SERVER = "192.168.1.XXX" # IP or hostname to InfluxDB server
INFLUXDB_PORT = 8086 # Port on InfluxDB server
INFLUXDB_USERNAME = ""
INFLUXDB_PASSWORD = ""
INFLUXDB_DATABASE = "dev_pihole"
DELAY = 10 # seconds

def send_msg(domains_blocked, dns_queries_today, ads_percentage_today, ads_blocked_today):

	json_body = [
	    {
	        "measurement": "piholestats." + HOSTNAME.replace(".", "_"),
	        "tags": {
	            "host": HOSTNAME
	        },
	        "fields": {
	            "domains_blocked": int(domains_blocked),
                    "dns_queries_today": int(dns_queries_today),
                    "ads_percentage_today": float(ads_percentage_today),
                    "ads_blocked_today": int(ads_blocked_today)
	        }
	    }
	]

	client = InfluxDBClient(INFLUXDB_SERVER, INFLUXDB_PORT, INFLUXDB_USERNAME, INFLUXDB_PASSWORD, INFLUXDB_DATABASE) # InfluxDB host, InfluxDB port, Username, Password, database
	# client.create_database(INFLUXDB_DATABASE) # Uncomment to create the database (expected to exist prior to feeding it data)
	client.write_points(json_body)

api = requests.get(PIHOLE_API) # URI to pihole server api
API_out = api.json()

#print (API_out) # Print out full data, there are other parameters not sent to InfluxDB

domains_blocked = (API_out['domains_being_blocked'])#.replace(',', '')
dns_queries_today = (API_out['dns_queries_today'])#.replace(',', '')
ads_percentage_today = (API_out['ads_percentage_today'])#
ads_blocked_today = (API_out['ads_blocked_today'])#.replace(',', '')

send_msg(domains_blocked, dns_queries_today, ads_percentage_today, ads_blocked_today)

Save and Exit.

I have the file run on a cron job every minute. Others set it up as a service but cron job works just fine for me:

crontab -e
*/1 * * * * /usr/bin/python /home/pi/influx_scripts/piholestats.py

We need to create Influx database next, I carried this out through the Chronograf web interface but add it through the terminal by the below if required:

influx
create database dev_pihole
exit

Now onto Grafana Dash:

Add the “dev_pihole” database to the Grafana Data Sources list.

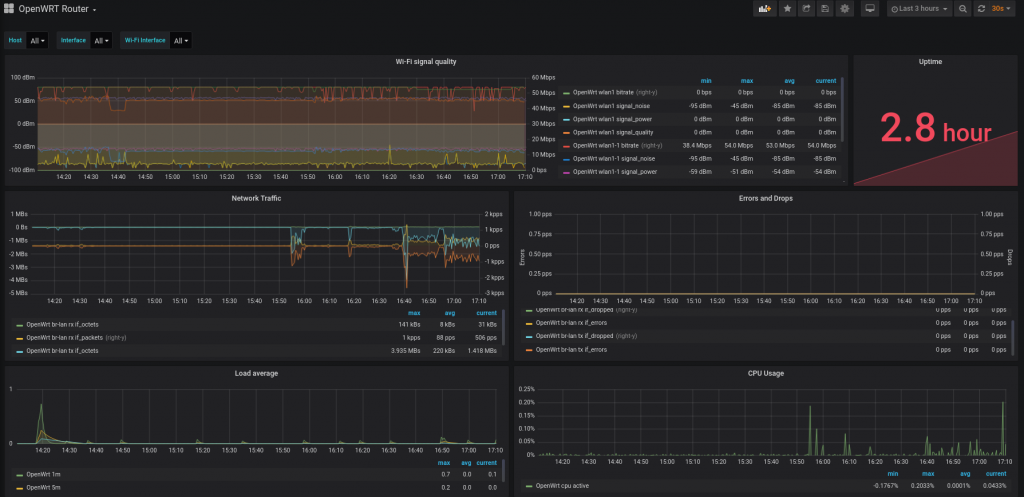
Next go to “Import dashboard” and paste in the JSON code on my Github. I tweaked a previous dashboard slightly.

All done!

OpenWRT logging to InfluxDB & Grafana Dash

Building on the work of others before me, below you will find a complete tutorial to get OpenWRT logging to InfluxDB using the “connectd” plugin. All required code available on my GitHub.

SSH into your router console: ssh root@xxx.xxx.xxx.xxx and run the below:

opkg update
opkg install luci-app-statistics collectd collectd-mod-cpu \
collectd-mod-interface collectd-mod-iwinfo \
collectd-mod-load collectd-mod-memory collectd-mod-network collectd-mod-uptime collectd-mod-thermal collectd-mod-openvpn collectd-mod-dns collectd-mod-wireless
/etc/init.d/luci_statistics enable
/etc/init.d/collectd enable

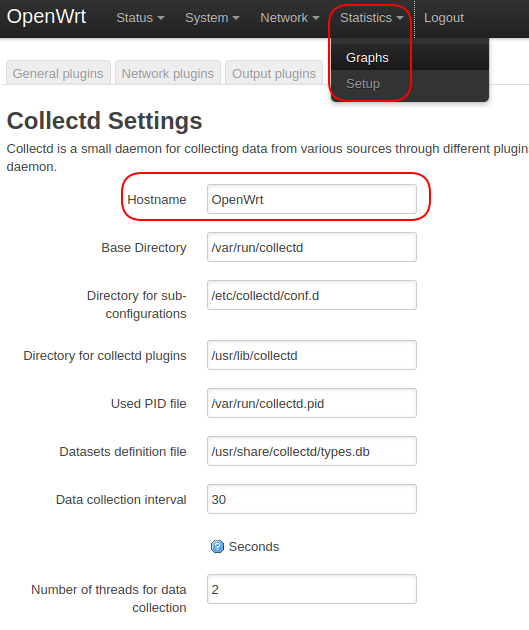
Go to router Web Interface and there is a new “Statistics” tab, its mostly setup but quick configuration: (also see screenshot below)

  • Go to Statistics -> Setup -> add ‘Hostname’ field and populate it. (doesn’t exist by default for some reason)
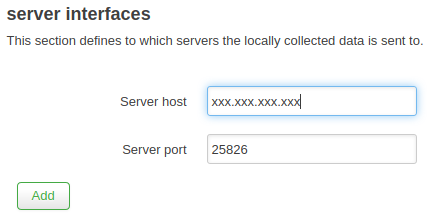
  • Go to Statistics -> Setup -> Output plugins -> add the details of your InfuxDB server. (leave the port as 25826)

We are finished with the router now, I rebooted it, not sure if was 100% necessary.

Next SSH into your InfluxDB console: ssh xxx@xxx.xxx.xxx.xxx

Create file: /usr/local/share/collectd/types.db (add file from my Github)

sudo nano /usr/local/share/collectd/types.db

We now need to enable the “collectd” plugin in InfluxDB config:

sudo nano /etc/influxdb/influxdb.conf

Configure it so it is the same as below:

[[collectd]]
   enabled = true
   bind-address = ":25826"
   database = "dev_collectd"
   retention-policy = ""
  #
  # The collectd service supports either scanning a directory for multiple types
  # db files, or specifying a single db file.
   typesdb = "/usr/local/share/collectd/types.db"
  #
   security-level = "none"
   auth-file = "/etc/collectd/auth_file"

  # These next lines control how batching works. You should have this enabled
  # otherwise you could get dropped metrics or poor performance. Batching
  # will buffer points in memory if you have many coming in.

  # Flush if this many points get buffered
   batch-size = 5000

  # Number of batches that may be pending in memory
   batch-pending = 10

  # Flush at least this often even if we haven't hit buffer limit
   batch-timeout = "10s"

  # UDP Read buffer size, 0 means OS default. UDP listener will fail if set above OS max.
   read-buffer = 0

  # Multi-value plugins can be handled two ways.
  # "split" will parse and store the multi-value plugin data into separate measurements
  # "join" will parse and store the multi-value plugin as a single multi-value measurement.
  # "split" is the default behavior for backward compatibility with previous versions of influxdb.
  # parse-multivalue-plugin = "split"

Exit & Save.

Add new database in InfluxDB, I carried this out through the Chronograf web interface but add in through the terminal by the below if required:

    influx
    create database dev_collectd
    exit

Restart InfluxDB to activate the new config:

sudo service influxd restart

Now onto Grafana Dash:

Add the “dev_collectd” database to the Grafana Data Sources list.

Next go to “Import dashboard” and paste in the JSON code on my Github. I tweaked a previous dashboard slightly.

All done!

References I used:
https://blog.christophersmart.com/2019/09/09/monitoring-openwrt-with-collectd-influxdb-and-grafana/
https://wiki.opnfv.org/display/fastpath/Installing+and+configuring+InfluxDB+and+Grafana+to+display+metrics+with+collectd

Notes on what doesn’t work:
Can’t see amount of connected wireless devices.
OpenVPN stats also not working.
Its on the to do list if I can get this going again.